BTC ETH Daily Recap — 2026-09-27

BTC ETH Daily Recap — 2026-09-27
Today at a Glance
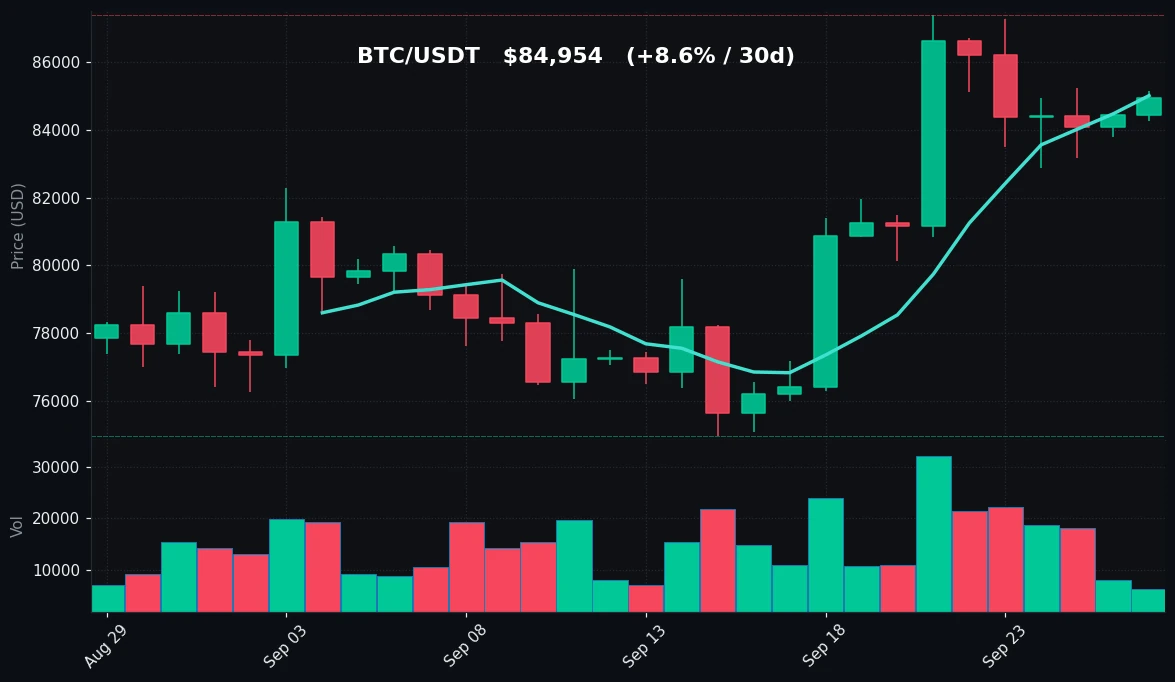
Bitcoin closed the session at $84,954, up 0.62% over 24 hours, trading inside a narrow $902 range between $84,257 and $85,159. The move extends a constructive week: BTC is +4.65% over 7 days and +8.60% over 30 days, though it remains roughly 2.8% below the 7-day and 30-day high of $87,396. Price continues to hold above both the MA7 ($85,018) and the MA30 ($79,969), keeping the medium-term structure tilted upward.
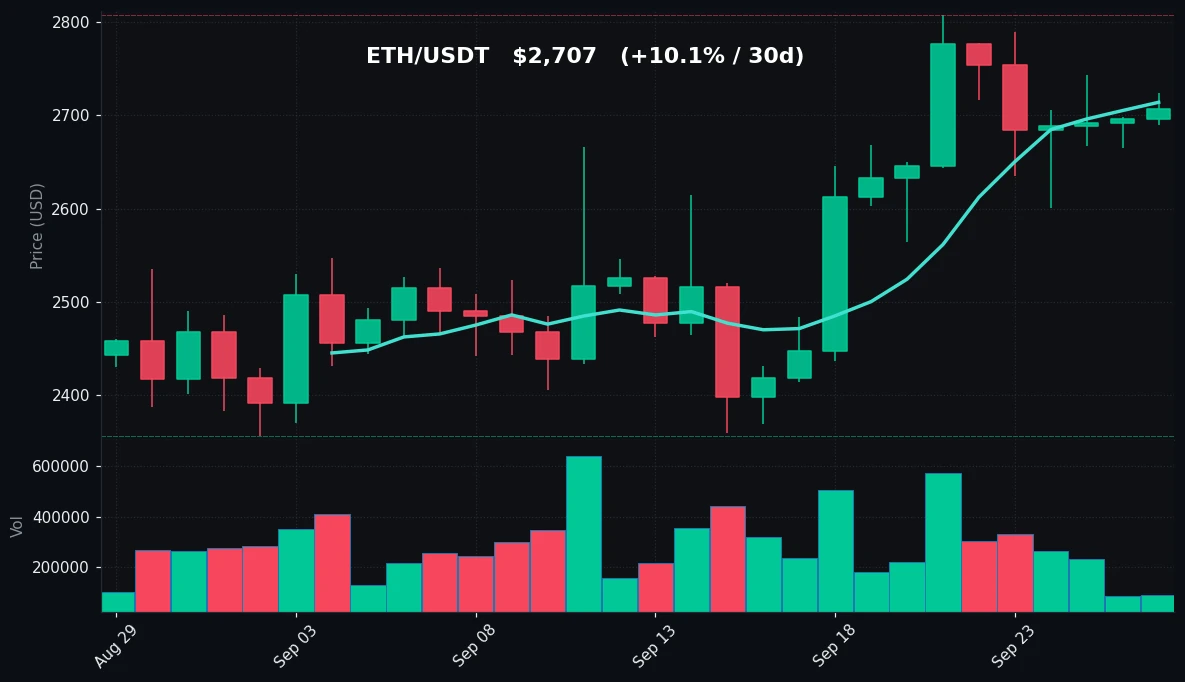
Ethereum printed $2,707, up 0.39% on the day within a $34 range ($2,690–$2,724). ETH is +2.33% on the week and +10.14% on the month, with the 30-day low at $2,356 underlining the scale of the recovery. Like BTC, ETH sits just below its 7-day and 30-day high of $2,807.
The standout feature across both assets is participation: volume versus the 7-day average is only 0.34x for BTC and 0.32x for ETH, meaning this advance is happening on thin flow. RSI(14) reads 72.0 for BTC and 67.7 for ETH.
Bitcoin Analysis
TradingView Live (4h)
Bitcoin's trend structure remains constructive on the timeframes that matter. At $84,954, price is trading above the MA7 of $85,018 — effectively flat against it — and comfortably above the MA30 of $79,969. That ~$5,000 gap between spot and the 30-day moving average reflects the strength of the September recovery off the 30-day low of $74,968. The sequence of higher lows from that base through the $80,850 weekly low to current levels is intact, and the 7-day gain of +4.65% is a meaningful continuation of the +8.60% 30-day move.
The immediate technical picture is one of compression near the top of the range. BTC's 24-hour span of $902 is unusually tight relative to the $6,546 spread between the 7-day high ($87,396) and low ($80,850). Price is coiling in the upper portion of that band, roughly $2,442 below the $87,396 ceiling. That level is the clear resistance reference: it is both the 7-day and 30-day high, making it a well-defined pivot that has capped two separate lookback windows. On the downside, the first structural support is the MA7 zone around $85,018, followed by the weekly low at $80,850, with the MA30 at $79,969 acting as the deeper trend floor.
Momentum is the caveat. RSI(14) at 72.0 places BTC in overbought territory on the standard 70 threshold. Overbought readings are not inherently bearish — in sustained uptrends, RSI can hold above 70 for extended periods — but they do indicate that the current pace of gains is stretched relative to recent price history. The more notable signal is volume: at 0.34x the 7-day average, participation is roughly one-third of the recent norm. Thin volume during an overbought push means less conviction behind each increment, and it also means the market is more susceptible to sharp moves in either direction when liquidity returns.
Taken together, the data describes a market that is trend-positive but momentum-extended and liquidity-light. Price is holding above its moving averages, the monthly trajectory is up, and resistance at $87,396 is clearly defined. The absence of volume is the primary inconsistency — an advance without participation is more fragile than one with it, though it is not by itself a reversal signal. No directional prediction is warranted from these inputs; the observable facts are an uptrend, an overbought RSI, and unusually low volume.
Ethereum Analysis
TradingView Live (4h)
Ethereum's setup mirrors Bitcoin's with marginally softer momentum characteristics. At $2,707, ETH is trading just below its MA7 of $2,714 and well above its MA30 of $2,539 — a gap of roughly $168, or about 6.6% of spot. That premium to the 30-day average confirms the strength of the move off the 30-day low of $2,356, and the +10.14% monthly gain is actually stronger than BTC's +8.60% over the same window. The weekly gain of +2.33%, however, lags BTC's +4.65%, suggesting ETH's outperformance was concentrated earlier in the month rather than in the most recent stretch.
The 24-hour range was extremely narrow: $2,690 to $2,724, a spread of just $34 on a $2,707 close — about 1.3% of price. Against the 7-day range of $2,600 to $2,807 ($207 wide), today's action represents significant compression. ETH is trading in the upper half of the weekly band, approximately $100 below the $2,807 high that also marks the 30-day peak. That $2,807 level is the primary resistance reference for the same reason it is for BTC: it has capped both the 7-day and 30-day windows.
Support structure is layered. The MA7 at $2,714 sits essentially at spot, meaning ETH is marginally below its short-term average — a slight loss of momentum relative to BTC, which is holding above its own MA7. Below that, the weekly low at $2,600 is the first meaningful structural floor, followed by the MA30 at $2,539 and then the 30-day low at $2,356.
RSI(14) at 67.7 is below the 70 overbought threshold, placing ETH in neutral-to-firm territory rather than overbought. This is a meaningful divergence from BTC's 72.0: ETH has more headroom before reaching stretched momentum conditions. Volume tells the same thin-liquidity story as BTC, at 0.32x the 7-day average — even lighter than Bitcoin's 0.34x.
The composite picture for ETH is a market in a confirmed monthly uptrend, consolidating near the upper end of its weekly range, with momentum that is firm but not extended and volume that is conspicuously absent. The proximity of price to the MA7 and the distance from the MA30 define the current tension: short-term stalling within a medium-term advance.
Key Technical Levels
| Asset | Support | Resistance | RSI |
|---|---|---|---|
| BTC | $85,018 (MA7) / $80,850 (7d low) / $79,969 (MA30) | $87,396 (7d & 30d high) | 72.0 — overbought |
| ETH | $2,714 (MA7) / $2,600 (7d low) / $2,539 (MA30) | $2,807 (7d & 30d high) | 67.7 — neutral |
BTC vs ETH Dynamic
BTC and ETH are moving in the same direction but not at the same speed, and the divergence is informative. Over 24 hours the two are nearly identical (+0.62% vs +0.39%), and both printed similarly compressed daily ranges on similarly thin volume (0.34x vs 0.32x the 7-day average), which points to a shared macro driver rather than asset-specific flow. The separation appears in the momentum and positioning data: BTC is above its MA7 and carries an overbought RSI of 72.0, while ETH is marginally below its MA7 with a neutral 67.7 RSI. On the monthly horizon ETH leads (+10.14% vs +8.60%), but on the week BTC leads (+4.65% vs +2.33%). The read-through is that ETH front-loaded its move earlier in the 30-day window and has since ceded short-term leadership to BTC, which is now the more extended of the two. Both share the same resistance logic — their respective 7-day highs double as 30-day highs — so a break or rejection at $87,396 and $2,807 would likely be correlated events.
Strategy Fit
Today's data presents a specific combination: positive trend structure, extended momentum on BTC, and unusually low volume on both assets. Low volume with tight ranges — BTC's $902 daily span and ETH's $34 span — is the classic environment in which grid strategies tend to operate, because range-bound oscillation around a defined band allows a grid bot to harvest repeated small moves. The relevant bands are visible in the data: BTC between roughly $80,850 and $87,396, ETH between $2,600 and $2,807. Pionex offers built-in grid trading bots that are designed for exactly this kind of sideways-to-mildly-trending market, and the platform's futures grid and spot grid options allow users to set ranges aligned with the levels above.
For participants whose mandate is accumulation rather than range capture, the extended RSI on BTC and the thin volume on both assets argue for a disciplined DCA approach rather than chasing the current print — Pionex's built-in DCA bot supports scheduled, rules-based entries that do not depend on timing a single price. A trend-following approach has the weakest fit today: trends require volume and expanding ranges to sustain, and both are currently absent, so trend entries near resistance with an overbought RSI carry asymmetric risk. Whichever framework is used, position sizing should account for the fact that low-liquidity conditions can produce outsized moves when volume returns.
Risk Disclaimer
This content is for informational purposes only and does not constitute financial, investment, or trading advice. Nothing here is a recommendation to buy, sell, or hold any asset. Cryptocurrency markets are highly volatile and can result in the total loss of capital. Technical indicators, moving averages, RSI readings, and volume data describe past and current market conditions only; they do not predict future price movement. Always conduct your own research and consult a licensed financial professional before making any investment decision.
FAQ
What price did Bitcoin close at on 2026-09-27?
BTC closed at $84,954, up 0.62% over 24 hours, within a daily range of $84,257 to $85,159.
Is Bitcoin overbought right now?
BTC's RSI(14) is 72.0, which is above the conventional 70 threshold and therefore classified as overbought. Overbought readings indicate stretched momentum but do not by themselves signal a reversal.
Why is trading volume so low?
BTC volume is running at 0.34x its 7-day average and ETH at 0.32x. This means current participation is roughly one-third of the recent norm, producing narrow daily ranges for both assets.
What are the key resistance levels for BTC and ETH?
Both assets are capped by their 7-day highs, which also serve as 30-day highs: $87,396 for BTC and $2,807 for ETH.
Which strategy type fits current conditions?
With tight ranges and low volume, grid strategies are commonly associated with this environment; Pionex offers built-in grid and DCA bots. Trend-following has a weaker fit given the absence of volume expansion. This is not financial advice.


