BTC ETH Daily Recap — 2026-09-28

BTC ETH Daily Recap — 2026-09-28
Today at a Glance
Bitcoin is trading at $83,515, down 1.13% over the past 24 hours, with an intraday range of $82,598 to $84,999. On a weekly basis, BTC is down 3.58%, though it remains up 7.51% over 30 days. The 7-day high sits at $87,279, while the 7-day low matches today's intraday low of $82,598. The 30-day range spans $74,968 to $87,396. BTC's MA7 is $84,505 and MA30 is $80,129, with RSI(14) at 65.2 and volume at 0.77x the 7-day average.
Ethereum is at $2,686, down 0.11% in 24 hours, within a range of $2,636 to $2,704. ETH is down 3.26% on the week but up 11.12% over 30 days. The 7-day high is $2,789 and low is $2,600; the 30-day range is $2,356 to $2,807. ETH's MA7 is $2,698 and MA30 is $2,546, with RSI(14) at 64.0 and volume at 0.66x the 7-day average.
Bitcoin Analysis
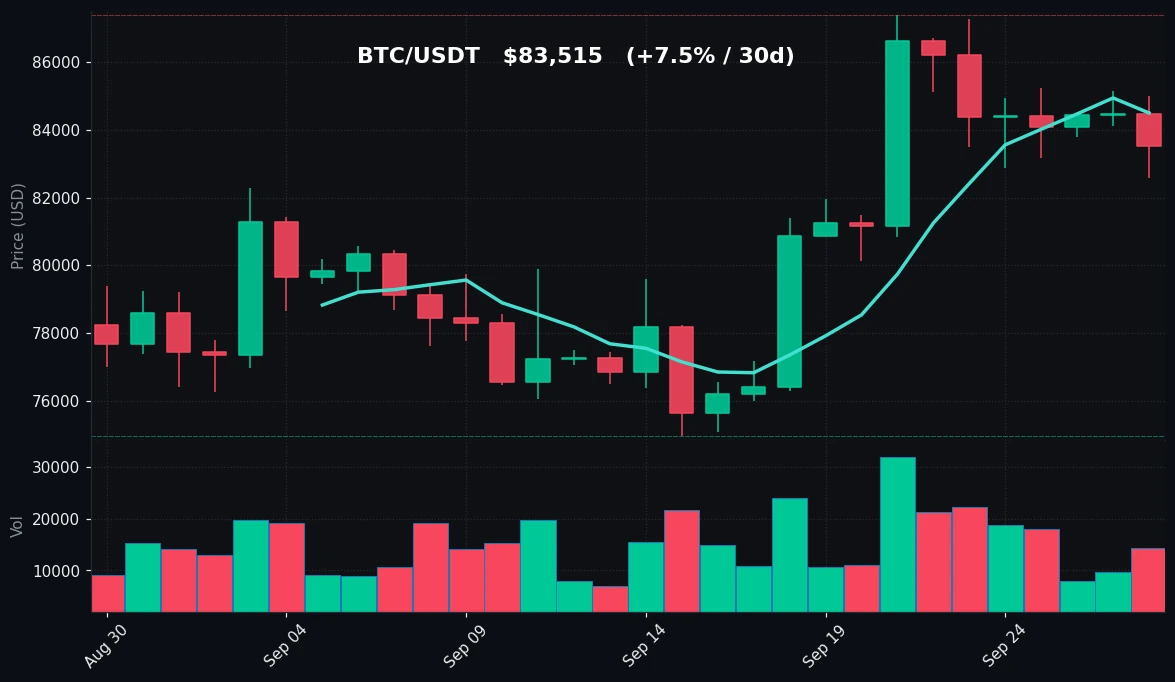
TradingView Live (4h)
Bitcoin's daily close near $83,515 places it below its 7-day moving average of $84,505 but comfortably above its 30-day moving average of $80,129. That configuration — price sandwiched between a declining short-term average and a rising intermediate average — describes a market that has cooled off after a strong 30-day advance of 7.51% but has not surrendered its medium-term uptrend. The gap between spot and MA30 is roughly $3,386, or about 4.2%, which is a meaningful cushion but not an extreme extension.
The immediate technical picture is defined by a well-documented range. The 7-day high of $87,279 and the 30-day high of $87,396 sit within $117 of each other, forming a clear resistance shelf in the high-$87,000s that has now rejected price twice in the observable window. On the downside, $82,598 is the pivot: it is simultaneously today's low and the 7-day low, which gives it added significance as a level where sellers have been absorbed. Below that, the 30-day low at $74,968 marks the floor of the broader advance and sits well under the MA30.
Momentum is best described as constructive but decelerating. RSI(14) at 65.2 is below the 70 overbought threshold, meaning the indicator is in bullish territory without flashing an extreme reading. Notably, price has fallen 3.58% over seven days while RSI has stayed elevated, which is consistent with consolidation rather than distribution — the indicator has room to move in either direction. Volume at 0.77x the 7-day average is the most telling data point of the session: participation is thin. A 1.13% decline on below-average volume suggests lack of aggressive selling rather than conviction-driven downside.
The interaction between the MA7 and spot price is the level to monitor. BTC has spent recent sessions oscillating around $84,500, and reclaiming that line would put the $87,279–$87,396 band back in play. Conversely, a sustained break of $82,598 would shift focus toward the MA30 at $80,129, which is the next structurally significant support. For now, the data describes a market digesting a 30-day rally inside a defined $82,598–$87,396 channel.
Ethereum Analysis
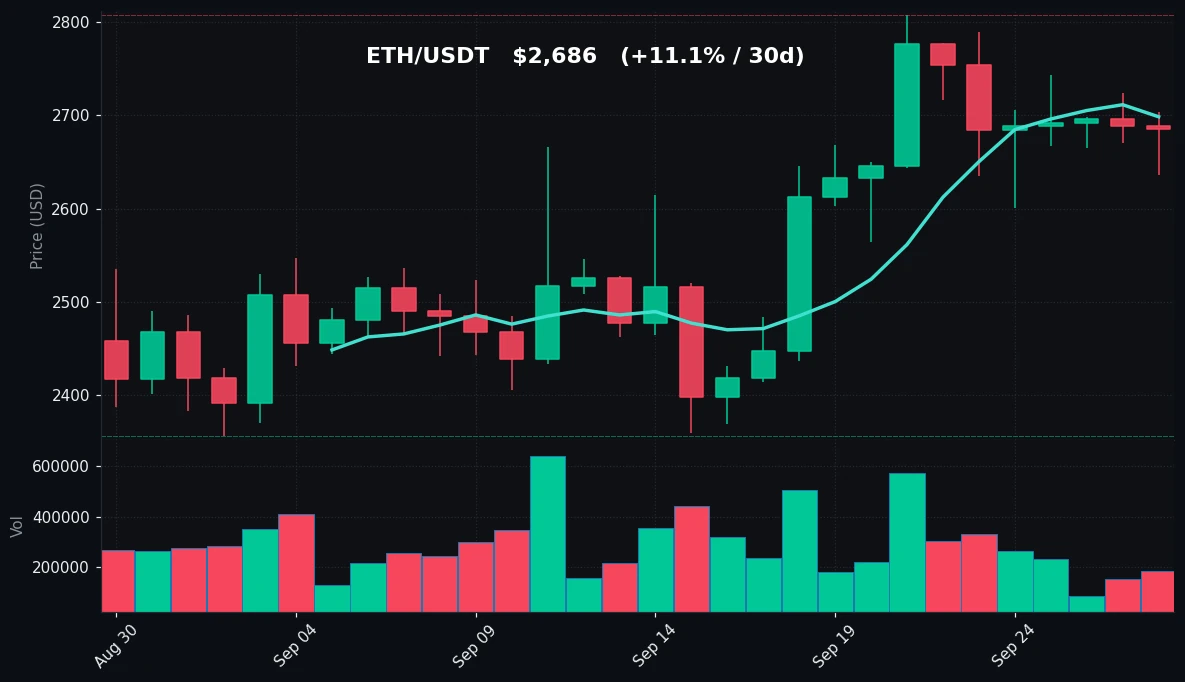
TradingView Live (4h)
Ethereum at $2,686 is trading marginally below its MA7 of $2,698 — a gap of just $12, or roughly 0.4%. That is a far tighter relationship to the short-term average than Bitcoin's, and it tells a different story: ETH is essentially pinned to its one-week mean, consolidating sideways rather than pulling back. The 30-day moving average at $2,546 sits about $140 below spot, a 5.2% cushion that reflects the strong 11.12% monthly gain.
The range structure is similarly well defined. ETH's 7-day high of $2,789 and 30-day high of $2,807 are only $18 apart, creating a resistance cluster just under $2,800 that has capped the advance. On support, the 7-day low of $2,600 and the 30-day low of $2,356 bracket the current price, with $2,600 serving as the first line of defense and the MA30 at $2,546 reinforcing it from below. The 24-hour range of $2,636 to $2,704 was narrow — a $68 span — and the 0.11% daily decline is effectively flat.
RSI(14) at 64.0 mirrors Bitcoin's 65.2 almost exactly, placing both assets in the same neutral-to-bullish momentum zone below overbought. This parallel reading suggests the two markets are being driven by the same macro flow rather than idiosyncratic factors. The key difference is volume: ETH traded at 0.66x its 7-day average versus BTC's 0.77x, meaning Ethereum's session was even quieter on a relative basis. Low volume near a flat price is the classic signature of a coiling range.
Structurally, ETH's position relative to MA30 is the more important signal. At $2,686, price is 5.2% above the intermediate trend line, and the MA30 itself has been rising alongside the 30-day gain. The $2,600–$2,807 band is the operative range, with $2,698 (MA7) as the immediate pivot. A close above MA7 would target the $2,789–$2,807 resistance; a loss of $2,600 would bring the $2,546 MA30 into focus. Today's data shows ETH holding the middle of that structure with momentum intact but no urgency in either direction.
Key Technical Levels
| Asset | Support | Resistance | RSI |
|---|---|---|---|
| BTC | $82,598 (7d low) / $80,129 (MA30) | $87,279–$87,396 (7d/30d high) | 65.2 — neutral, approaching overbought |
| ETH | $2,600 (7d low) / $2,546 (MA30) | $2,789–$2,807 (7d/30d high) | 64.0 — neutral, approaching overbought |
BTC vs ETH Dynamic
Bitcoin and Ethereum are moving in near-lockstep, and the numbers make the correlation unusually clean. Both posted single-digit negative 7-day returns — BTC -3.58%, ETH -3.26% — and both are up solidly over 30 days, with ETH's +11.12% outpacing BTC's +7.51%. Their RSI readings are separated by just 1.2 points (65.2 vs 64.0), and both sit below their 7-day moving averages while holding well above their 30-day averages. The one divergence worth noting is relative volume: BTC at 0.77x versus ETH at 0.66x, meaning capital was marginally more active in Bitcoin during a down session. That is a mild defensive tilt, not a rotation. With both assets compressing into the middle of their ranges on light volume, the pair is trading as a single risk complex rather than two independent markets.
Strategy Fit
The data describes a low-volatility, range-bound session: BTC's 24-hour range was roughly 2.9% of spot, ETH's about 2.5%, and both traded at well below average volume (0.77x and 0.66x). Both assets are consolidating between clearly defined 7-day lows and 7-day highs, with RSI in neutral territory. That environment — defined boundaries, muted momentum, thin participation — is the textbook condition where grid strategies tend to be considered, since they are designed to harvest oscillation within a range. DCA-style approaches are also a natural fit for participants who want to accumulate through consolidation without timing entries. Trend-following, by contrast, typically requires a confirmed breakout or breakdown, and neither asset has delivered one today. For traders using Pionex, the platform's built-in bots — including grid trading and DCA bots — are designed for exactly these conditions, with parameters that can be set around the observed support and resistance levels. Strategy selection should always match the user's own risk tolerance and time horizon.
Risk Disclaimer
This market recap is for informational purposes only and does not constitute financial, investment, or trading advice. Cryptocurrency markets are highly volatile and can result in the total loss of capital. The technical levels, indicators, and strategy references discussed above are observations of historical and current data, not recommendations or predictions. Past performance is not indicative of future results. Always conduct your own research and consult a qualified financial professional before making any investment decisions.
FAQ
What price is Bitcoin trading at on 2026-09-28?
BTC/USDT is at $83,515, down 1.13% over 24 hours, with an intraday range of $82,598 to $84,999.
What price is Ethereum trading at on 2026-09-28?
ETH/USDT is at $2,686, down 0.11% over 24 hours, with an intraday range of $2,636 to $2,704.
Are BTC and ETH overbought right now?
No. BTC's RSI(14) is 65.2 and ETH's is 64.0 — both below the 70 threshold commonly used to define overbought conditions, though both are in the upper half of the neutral band.
What are the key support and resistance levels?
BTC support sits at $82,598 (7-day low) with resistance at $87,279–$87,396. ETH support is $2,600 (7-day low) with resistance at $2,789–$2,807.
What do the moving averages indicate?
BTC trades below its MA7 of $84,505 but above its MA30 of $80,129. ETH trades just below its MA7 of $2,698 and above its MA30 of $2,546 — both showing short-term cooling within a medium-term uptrend.


