BTC ETH Daily Recap — 2026-09-29

BTC ETH Daily Recap — 2026-09-29
Today at a Glance
Bitcoin closed the session at $84,028, up 0.63% over 24 hours, trading inside a narrow $1,788 range between $82,776 and $84,564. The move extends a modest 30-day gain of 6.93%, though the weekly candle remains negative at -2.53%, reflecting a market that has cooled from its recent $87,396 peak. Volume tells the more interesting story: BTC traded at just 0.48x its 7-day average, a pronounced contraction that suggests participation has thinned considerably near current levels. Ethereum outperformed on the day, adding 1.25% to $2,722, with a 30-day gain of 10.33% and a weekly decline of only 1.13%. ETH's volume came in at 0.86x its 7-day average — lighter than normal, but noticeably more active than BTC's relative reading. Both assets sit above their 7-day and 30-day moving averages, and both register overbought RSI readings, with ETH at 81.0 and BTC at 77.0. That combination — extended momentum, thin volume, and price holding above trend — frames today's recap.
Bitcoin Analysis
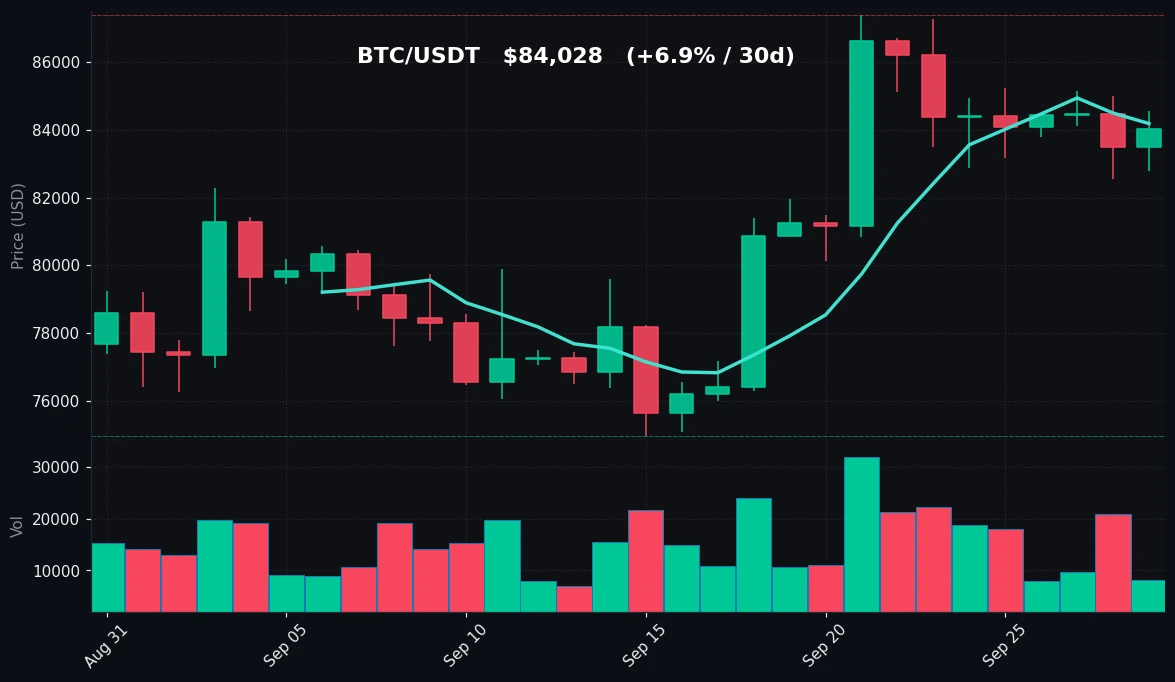
TradingView Live (4h)
Bitcoin's daily structure remains constructive on a medium-term basis. At $84,028, price holds above both the MA7 at $84,192 — marginally, in fact slightly below it — and comfortably above the MA30 at $80,340. The relationship between the two averages is the key structural signal: the 7-day sits roughly $3,850 above the 30-day, a positive spread that confirms the prevailing uptrend from the $74,968 low recorded 30 days ago. That low-to-current advance of approximately 12% has been orderly rather than parabolic, which is consistent with the measured weekly pullback of 2.53% now underway.
On the levels that matter: the immediate reference is the 7-day high at $87,279, which also sits just beneath the 30-day high of $87,396 — a tight cluster that marks the ceiling of the current range. Below, the 7-day low at $82,563 aligns closely with today's intraday low of $82,776, creating a support shelf in the $82,500–$82,800 zone. Beneath that, the MA30 at $80,340 is the more meaningful structural floor, with the 30-day low at $74,968 as the deeper backstop. Price is currently mid-range, closer to resistance than to the MA30, which is typical of a consolidation after an advance.
Momentum is the caution flag. RSI(14) at 77.0 is firmly in overbought territory, and it has been sustained there rather than spiking and reverting — a pattern that often accompanies trend continuation but also leaves little cushion for negative surprises. The more notable datapoint is volume: at 0.48x the 7-day average, BTC is trading on roughly half its recent typical turnover. Thin volume during an overbought consolidation can mean either that sellers are absent (constructive) or that buyers have stepped back (cautionary); the data alone does not resolve which. What it does indicate is a market lacking conviction in either direction at this price.
The practical read: BTC is holding an uptrend above its MA30, consolidating below a well-defined $87,300–$87,400 resistance band, with immediate support at $82,500–$82,800. RSI is extended and volume is light. No directional conclusion is warranted from these facts alone — the structure is intact, but the momentum and participation readings argue for patience rather than urgency.
Ethereum Analysis
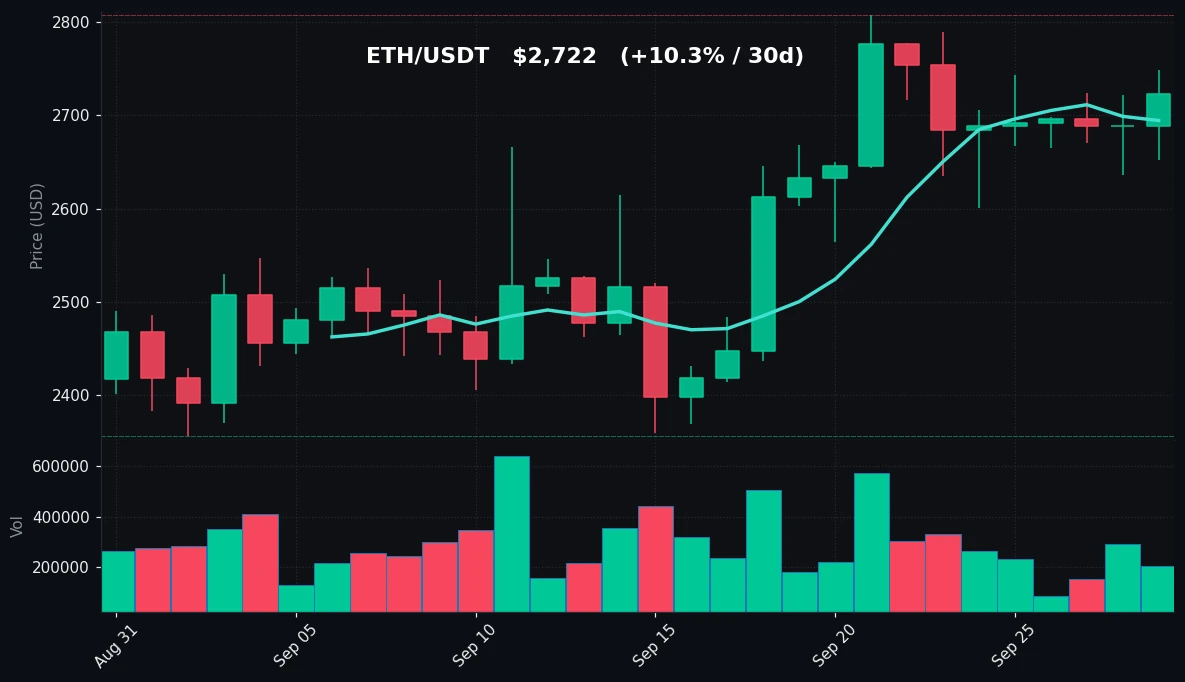
TradingView Live (4h)
Ethereum's setup mirrors Bitcoin's but with stronger relative momentum. At $2,722, ETH trades above both its MA7 at $2,694 and its MA30 at $2,557, and the spread between the two — roughly $137, or about 5% — confirms a firm uptrend anchored by the 30-day low of $2,356. The 30-day gain of 10.33% outpaces BTC's 6.93%, and the weekly decline of just 1.13% is roughly half BTC's 2.53% drawdown over the same window. Relative strength, in other words, currently favors ETH.
The level map is clean. Resistance clusters at the 7-day high of $2,789 and the 30-day high of $2,807 — a $18 band that has capped price twice in the past month. Today's high of $2,749 approached but did not test that zone. Support begins with the 7-day low at $2,600, which also corresponds to the lower end of recent consolidation, and today's intraday low of $2,652 sits just above it. The MA7 at $2,694 is the first line of defense on a closing basis, with the MA30 at $2,557 as the structural floor.
The standout metric is RSI(14) at 81.0 — more overbought than BTC's 77.0 and at a level that historically signals stretched short-term conditions. Unlike BTC, however, ETH's volume is closer to normal at 0.86x the 7-day average, meaning the advance is being accompanied by comparatively healthier participation. That combination — higher RSI but better relative volume — suggests ETH's move has broader backing, even as it also carries more immediate mean-reversion risk.
Structurally, ETH is the stronger of the two charts today: higher relative 30-day return, shallower weekly drawdown, and volume that is closer to typical. The offset is a more extended RSI. Price is consolidating below a defined $2,789–$2,807 resistance band while holding above a rising MA7. As with BTC, the data describes positioning, not direction — ETH is extended, supported, and trading below resistance on near-normal volume.
Key Technical Levels
| Asset | Support | Resistance | RSI |
|---|---|---|---|
| BTC | $82,563 – $82,776 (7d low / today's low); MA30 at $80,340 | $87,279 – $87,396 (7d / 30d high) | 77.0 — overbought |
| ETH | $2,600 (7d low); MA7 at $2,694; MA30 at $2,557 | $2,789 – $2,807 (7d / 30d high) | 81.0 — overbought |
BTC vs ETH Dynamic
BTC and ETH are moving in the same direction today — both up on the 24-hour timeframe, both down over 7 days, both up over 30 days, and both above their respective moving averages — but the magnitudes diverge in a way that matters. ETH's 24-hour gain of 1.25% is roughly double BTC's 0.63%; its 30-day gain of 10.33% leads BTC's 6.93%; and its weekly decline of 1.13% is less than half BTC's 2.53%. ETH also carries the higher RSI (81.0 vs 77.0) and the higher relative volume (0.86x vs 0.48x). The correlation in direction is intact, but the beta is running in ETH's favor: when the pair rises, ETH is rising more, and when the pair corrects, ETH is correcting less. That pattern is consistent with capital rotating toward the higher-beta asset during a consolidation phase in the larger one. The caveat is that ETH's more extended RSI means the relative-strength gap could narrow quickly if the complex cools. For now, the dynamic favors ETH on both momentum and participation metrics.
Strategy Fit
Today's conditions — overbought RSI on both assets, thin BTC volume, near-normal ETH volume, and price consolidating mid-range between defined support and resistance — are not a clean trend-following environment despite the intact uptrends, nor a clear reversal setup. That profile tends to suit range-oriented and accumulation-oriented approaches over directional momentum plays.
For traders working the defined bands, grid strategies fit the current structure: BTC's $82,500–$87,400 range and ETH's $2,600–$2,807 range provide the boundaries such bots are designed to harvest, and the low-volume chop between them is precisely the condition where grid fills accumulate. For those with a longer horizon, DCA remains a reasonable fit given that both assets hold above their MA30 and the 30-day trend is positive, though the overbought RSI argues against aggressive sizing at current levels. Trend-following strategies have less to work with today: volume is too light on BTC to confirm breakout attempts, and entering long into RSI 77–81 carries elevated pullback risk.
Pionex offers built-in bots that map directly to these conditions — grid trading bots for range-bound markets, DCA bots for scheduled accumulation, and trend-following bots for directional moves. The platform's futures grid and spot grid options allow the range parameters described above to be set explicitly. Strategy selection should follow the trader's own risk tolerance and time horizon; the market data here describes conditions, not recommendations.
Risk Disclaimer
This article is for informational purposes only and does not constitute financial, investment, or trading advice. Cryptocurrency markets are highly volatile and can result in the total loss of capital. Technical indicators such as RSI, moving averages, and volume ratios are descriptive tools, not predictive guarantees. Past performance and current market structure do not indicate future results. Readers should conduct their own research and consult a qualified financial professional before making any investment decision. Nothing in this recap should be interpreted as a recommendation to buy, sell, or hold any asset.
FAQ
What price did Bitcoin close at on 2026-09-29?
Bitcoin was at $84,028, up 0.63% over 24 hours, with an intraday range of $82,776 to $84,564.
Why is Ethereum's RSI higher than Bitcoin's?
ETH's RSI(14) is 81.0 versus BTC's 77.0, reflecting ETH's stronger relative performance — a 10.33% 30-day gain versus BTC's 6.93% — and its shallower weekly decline of 1.13% versus 2.53%.
What does BTC's low volume ratio indicate?
BTC's volume is at 0.48x its 7-day average, meaning turnover is roughly half of recent typical levels. This indicates reduced participation during the current consolidation, without implying a specific direction.
What are the key support and resistance levels right now?
BTC support sits at $82,563–$82,776 with resistance at $87,279–$87,396. ETH support is at $2,600 with resistance at $2,789–$2,807.
Are both assets overbought?
Yes. BTC's RSI of 77.0 and ETH's RSI of 81.0 are both above the conventional 70 threshold, placing both in overbought territory on the 14-period timeframe.


