BTC ETH Daily Recap — 2026-09-30

BTC ETH Daily Recap — 2026-09-30
Today at a Glance
Bitcoin closed the session at $84,308, up 0.77% over 24 hours after trading in a $82,956–$85,650 range. The move keeps BTC marginally below its 7-day high of $85,650 and roughly flat on the week at -0.11%, though the 30-day picture remains firmly positive at +8.87%. Price continues to hold above both the MA7 ($84,127) and MA30 ($80,518), confirming the broader uptrend structure remains intact. Volume relative to the 7-day average came in at 0.77x, indicating the advance occurred on lighter-than-usual participation.
Ethereum printed $2,701, up 0.87% on the day, with a 24-hour range of $2,657–$2,739. ETH is +0.62% over seven days and +11.69% over 30 days, outperforming BTC on both medium-term horizons. Like BTC, ETH trades above its MA7 ($2,690) and MA30 ($2,563). Volume versus the 7-day average registered 0.74x. Both assets show RSI readings in overbought territory — BTC at 76.6 and ETH at 78.1 — a condition worth monitoring as the week progresses.
Bitcoin Analysis
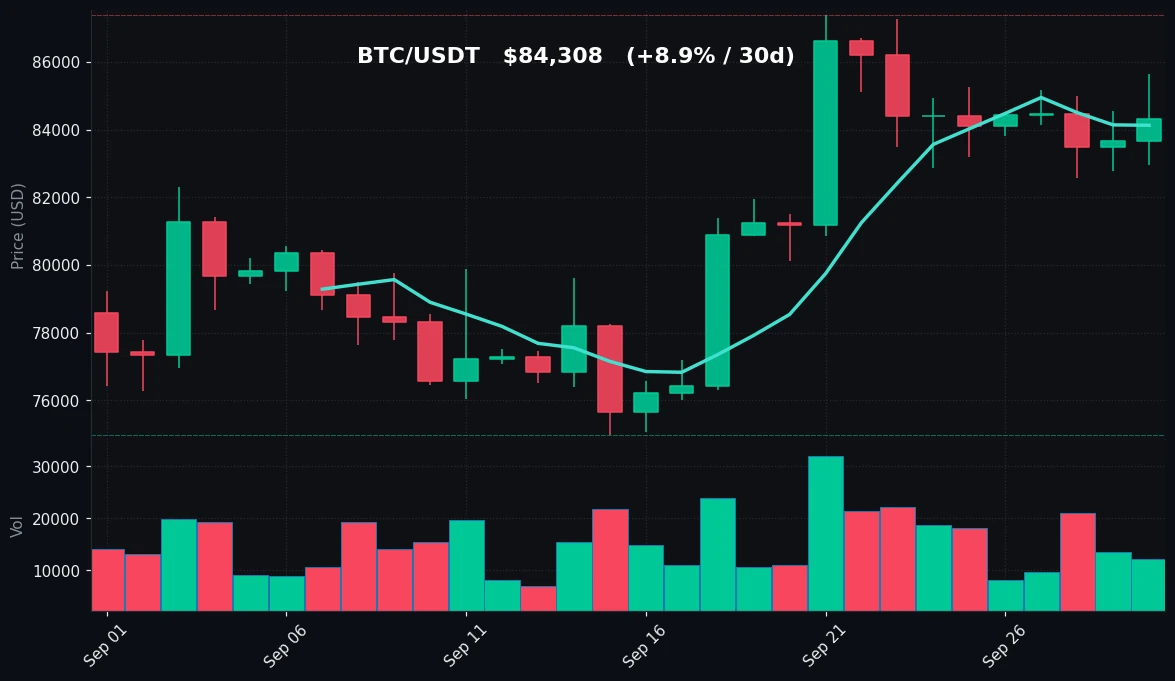
TradingView Live (4h)
Bitcoin's daily structure remains constructive. Price at $84,308 sits above the MA7 at $84,127 and comfortably above the MA30 at $80,518, keeping the short- and medium-term moving average alignment in a bullish configuration. The spread between spot and the MA30 — roughly 4.7% — reflects the strength of the September advance, which carried BTC from a 30-day low of $74,968 to a 30-day high of $87,396, a range of approximately 16.6%.
On the immediate horizon, the $85,650 level marks the 7-day high and the nearest overhead reference; it also coincides with the top of today's 24-hour range. Beyond that, the 30-day high at $87,396 stands as the more significant resistance zone, representing the peak of the current monthly advance. To the downside, the 7-day low at $82,563 is the first support of note, with the MA7 at $84,127 acting as a nearer dynamic level that price is currently straddling. A sustained hold above the MA7 would keep the short-term trend biased upward; a loss of that level would bring the $82,563 area into focus, followed by the MA30 at $80,518 as the deeper structural support.
Momentum readings warrant attention. RSI(14) at 76.6 places BTC in overbought territory, a condition that has accompanied the recent push toward the upper end of the monthly range. Overbought RSI does not by itself signal reversal, but it does indicate that recent gains have been concentrated and that the market is extended relative to its recent baseline.
Volume provides a notable caveat. At 0.77x the 7-day average, today's participation was below normal, meaning the +0.77% gain was achieved on relatively thin flow. Light-volume advances can be less durable than moves confirmed by expanding participation, and this divergence between price strength and volume is the key technical tension in the current BTC setup. The combination of overbought RSI, sub-average volume, and price pinned near the 7-day high defines a market that is strong but not fully confirmed by activity metrics.
Ethereum Analysis
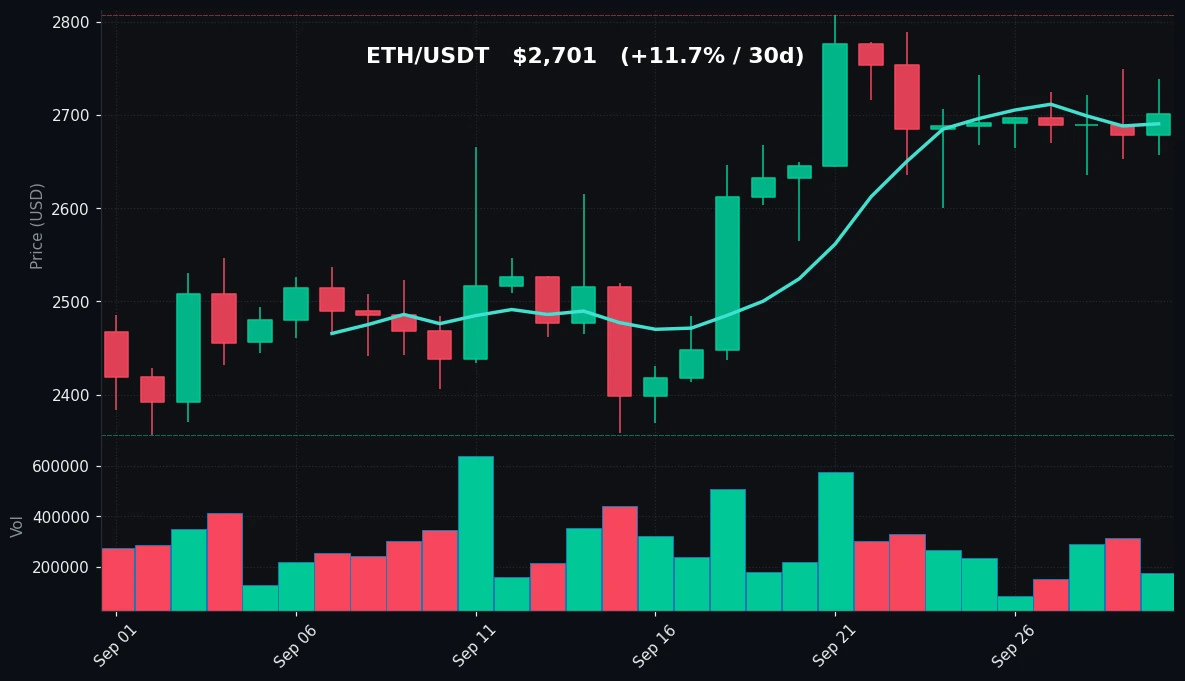
TradingView Live (4h)
Ethereum's technical posture mirrors Bitcoin's but with slightly stronger medium-term momentum. At $2,701, ETH trades above the MA7 ($2,690) and well above the MA30 ($2,563), with the gap to the 30-day average at roughly 5.4%. The 30-day range spans from $2,356 to $2,807, a move of approximately 19.1% — a wider percentage range than BTC's over the same window, consistent with ETH's higher beta.
The immediate resistance reference is the 7-day high at $2,749, which also aligns closely with today's 24-hour high of $2,739. Above that, the 30-day high at $2,807 represents the ceiling of the current monthly advance and the level that would confirm a continuation of the uptrend if reclaimed. On the support side, the 7-day low at $2,600 is the first meaningful floor, with the MA7 at $2,690 serving as the nearer dynamic support that price is currently holding just above. Below that, the MA30 at $2,563 provides the deeper structural backstop.
ETH's RSI(14) reads 78.1, marginally higher than BTC's and similarly in overbought territory. The 30-day gain of +11.69% versus BTC's +8.87% shows ETH has led on the monthly timeframe, and the 7-day performance (+0.62% vs BTC's -0.11%) shows it has also held up better on the week. This relative strength is a defining feature of the current setup.
As with BTC, volume is the soft spot. At 0.74x the 7-day average, ETH's advance occurred on lighter-than-normal flow — even lighter relative to its baseline than BTC's. The same tension applies: price is pressing the upper end of its recent range while participation metrics lag. ETH's overbought RSI, proximity to the 7-day high, and below-average volume collectively describe a market that is technically strong but operating without full volume confirmation.
Key Technical Levels
| Asset | Support | Resistance | RSI |
|---|---|---|---|
| BTC | $82,563 (7d low) / $80,518 (MA30) | $85,650 (7d high) / $87,396 (30d high) | 76.6 — overbought |
| ETH | $2,600 (7d low) / $2,563 (MA30) | $2,749 (7d high) / $2,807 (30d high) | 78.1 — overbought |
BTC vs ETH Dynamic
BTC and ETH are moving in close alignment today, with both posting sub-1% gains (+0.77% and +0.87% respectively) and both holding above their short- and medium-term moving averages. The correlation is evident in the shared technical signature: overbought RSI readings within 1.5 points of each other (76.6 vs 78.1), below-average volume on both sides (0.77x vs 0.74x), and prices positioned near 7-day highs while remaining below 30-day peaks. Where they diverge is in relative performance over longer windows — ETH's +11.69% 30-day gain outpaces BTC's +8.87%, and ETH's positive 7-day return contrasts with BTC's marginally negative one, suggesting ETH is currently the relative-strength leader within the pair. Both assets, however, share the same structural caveat: the recent advances have come on contracting volume, and both sit in overbought territory, meaning the pair's forward path likely depends on whether participation expands to confirm the current price levels.
Strategy Fit
Today's conditions present a specific profile: both assets are in uptrend structures above their key moving averages, but both show overbought RSI and below-average volume, with prices oscillating within well-defined 7-day ranges (BTC $82,563–$85,650; ETH $2,600–$2,749). This kind of range-bound, low-volume, extended-momentum environment is often associated with grid strategies, which seek to capture incremental moves within established boundaries rather than requiring a directional breakout. For traders with a longer horizon, DCA approaches remain a common framework for accumulating through extended conditions without timing entries. Trend-following strategies, by contrast, typically look for volume-confirmed breakouts above resistance — a condition not yet present given the 0.77x and 0.74x volume readings. Pionex offers built-in bots designed for these exact scenarios, including grid trading bots that operate within set ranges and DCA bots that execute scheduled accumulation, allowing users to match strategy to the current market structure. As always, strategy selection should align with individual risk tolerance and time horizon.
Risk Disclaimer
This market recap is provided for informational purposes only and does not constitute financial advice, investment advice, trading advice, or any other form of recommendation. The data and analysis presented reflect market conditions as of 2026-09-30 and are subject to change. Cryptocurrency markets are highly volatile and carry significant risk, including the potential loss of principal. Technical indicators such as RSI, moving averages, and volume comparisons are descriptive tools, not predictive guarantees. Past performance and current technical setups do not indicate future results. Readers should conduct their own research and consult a qualified financial professional before making any investment or trading decisions.
FAQ
What was Bitcoin's price on 2026-09-30?
BTC/USDT closed at $84,308, up 0.77% over 24 hours, with a daily range of $82,956 to $85,650.
What was Ethereum's price on 2026-09-30?
ETH/USDT traded at $2,701, up 0.87% over 24 hours, with a daily range of $2,657 to $2,739.
Are BTC and ETH overbought right now?
Both assets show RSI(14) readings in overbought territory — BTC at 76.6 and ETH at 78.1. Overbought conditions indicate extended momentum but do not by themselves predict a reversal.
How does current volume compare to recent averages?
Both assets are trading below their 7-day average volume: BTC at 0.77x and ETH at 0.74x, meaning recent price gains occurred on lighter-than-normal participation.
What are the key levels to watch?
For BTC, support sits at $82,563 (7-day low) and $80,518 (MA30), with resistance at $85,650 (7-day high) and $87,396 (30-day high). For ETH, support is at $2,600 (7-day low) and $2,563 (MA30), with resistance at $2,749 (7-day high) and $2,807 (30-day high).


