BTC ETH Daily Recap — 2026-10-01

BTC ETH Daily Recap — 2026-10-01
Today at a Glance
Bitcoin enters the first day of October trading at $83,791, up 0.20% over the past 24 hours, with an intraday range between $83,186 and $84,420. The move is modest, but it extends a constructive 30-day stretch that has added 8.34% to BTC's price. Over the past week, however, the asset is down 0.73%, suggesting consolidation after a strong September run. Ethereum trades at $2,691, up 0.17% on the day, and has outperformed BTC over the 30-day window with a 12.48% gain. ETH's 7-day performance is essentially flat at +0.09%. Both assets are showing overbought RSI readings — BTC at 75.2 and ETH at 76.3 — while volume across both markets is running below the 7-day average, at 0.57x for BTC and 0.67x for ETH. That combination of elevated momentum and thinning participation defines today's setup.
Bitcoin Analysis
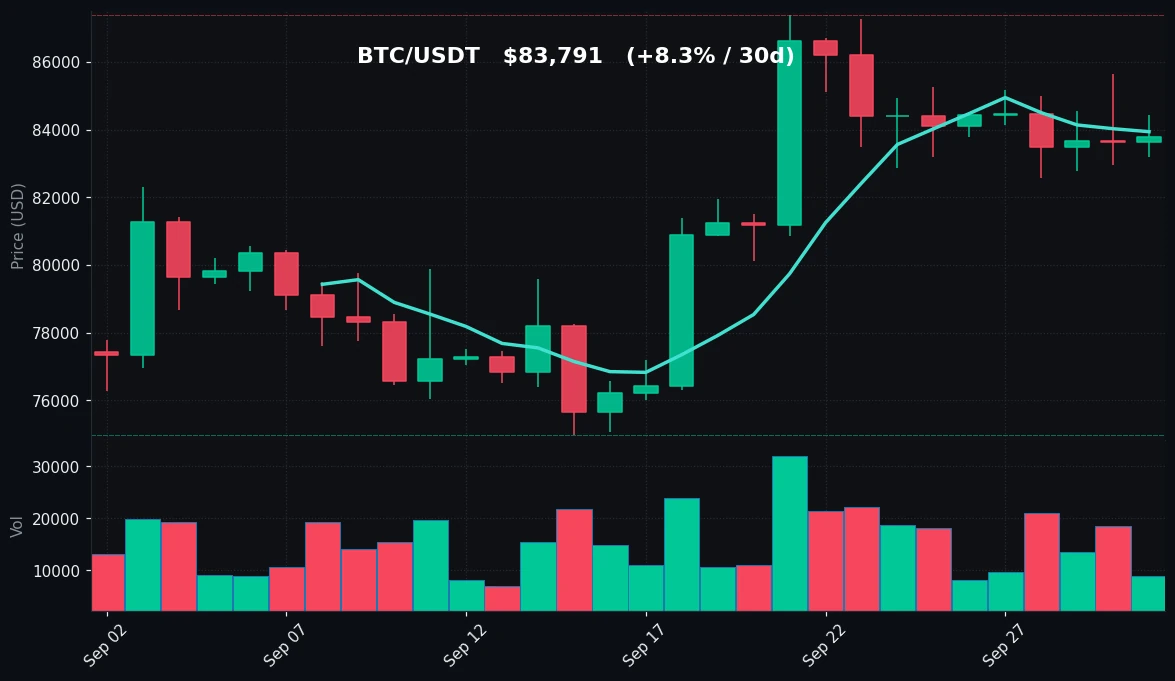
TradingView Live (4h)
Bitcoin's daily structure remains constructive despite the flat 24-hour print and the slightly negative 7-day reading. The asset is trading at $83,791, which sits just below its 7-day moving average of $83,940 and comfortably above its 30-day moving average of $80,707. That spread — roughly $3,084 between price and MA30 — reflects the strength of the September advance, during which BTC rallied from a 30-day low of $74,968 to a 30-day high of $87,396. The current price is therefore in the upper portion of its monthly range, about 4.1% below the 30-day peak.
On shorter timeframes, the picture is more balanced. The 7-day high of $85,650 and 7-day low of $82,563 frame a relatively tight $3,087 range, and today's session has so far stayed well inside it. The 24-hour high of $84,420 failed to challenge the weekly high, and the 24-hour low of $83,186 held above the weekly low. This compression suggests the market is digesting recent gains rather than reversing them.
The RSI(14) reading of 75.2 is the most notable technical signal. It places BTC firmly in overbought territory, a condition that has persisted as price pushed toward the 30-day high. Overbought readings are not inherently bearish — they can reflect sustained trend strength — but they do indicate that short-term momentum is stretched relative to recent price action. Traders watching mean-reversion setups would note the gap between price and MA30 as a potential magnet, while trend followers would point to the fact that price has not yet broken below its 7-day moving average in a meaningful way.
Volume is the other key input. At 0.57x the 7-day average, participation is notably light. Low-volume consolidation near highs can signal either healthy absorption or waning conviction, and the distinction typically resolves with the next expansion in volume. For now, the data shows a market that has stopped advancing but has not begun distributing.
Key levels to monitor: on the downside, the 7-day low at $82,563 is the first structural support, followed by the MA30 at $80,707. On the upside, the 7-day high at $85,650 and the 30-day high at $87,396 are the reference points for any renewed push.
Ethereum Analysis
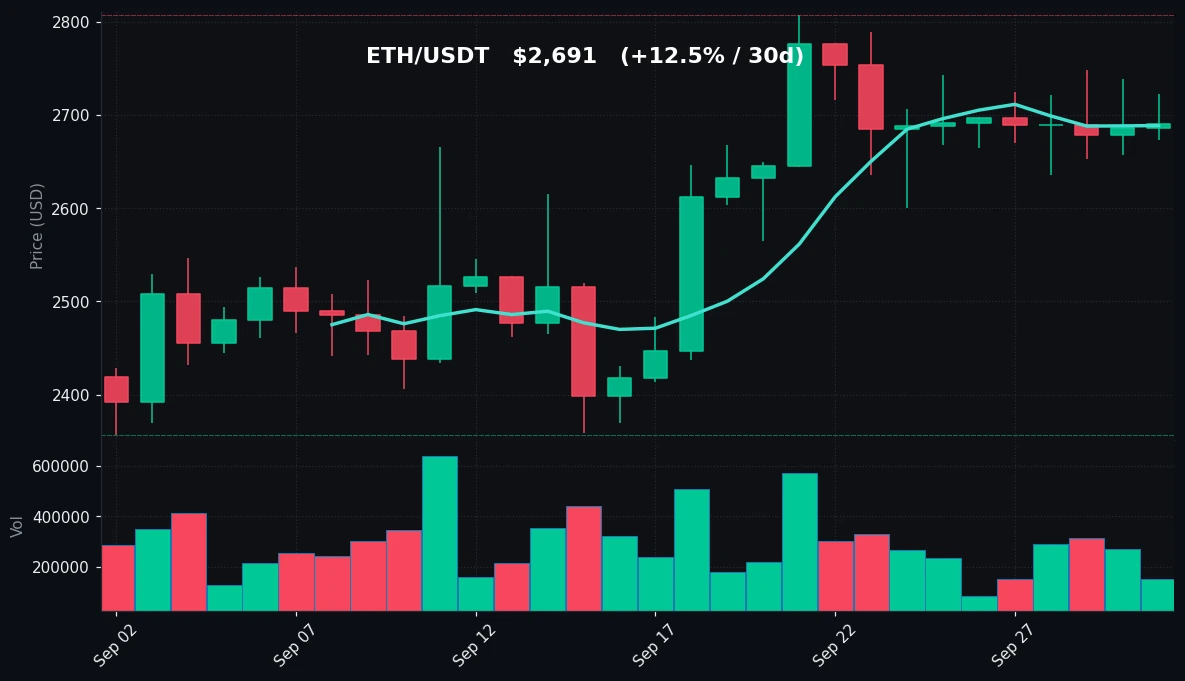
TradingView Live (4h)
Ethereum is trading at $2,691, up 0.17% over 24 hours and 0.09% over the past week — a near-perfect flatline on the weekly timeframe that masks a much stronger monthly trend. ETH has gained 12.48% over 30 days, outpacing BTC's 8.34% by a meaningful margin, and has rallied from a 30-day low of $2,356 to a 30-day high of $2,807. At the current price, ETH sits roughly 4.1% below that monthly peak, a drawdown almost identical in percentage terms to BTC's position relative to its own 30-day high.
The moving average structure is supportive. ETH's MA7 of $2,689 is essentially coincident with the current price of $2,691, indicating that the past week's consolidation has been balanced around this level. The MA30 of $2,571 sits $120 below the market, confirming that the broader uptrend remains intact and that the recent pause has not damaged the monthly trajectory. The 7-day range of $2,636 to $2,749 is tight — about 4.3% from low to high — and today's session has traded between $2,673 and $2,722, well within those bounds.
As with BTC, the RSI(14) reading of 76.3 is the standout signal. ETH is marginally more overbought than Bitcoin on this metric, consistent with its stronger 30-day performance. The overbought condition reflects the intensity of the September rally and suggests that near-term upside may require either a pause or a shallow pullback to reset momentum. Importantly, ETH has not yet shown a decisive rejection from these levels; the flat weekly performance indicates equilibrium rather than distribution.
Volume tells a similar story to BTC. At 0.67x the 7-day average, ETH's participation is light but slightly healthier than Bitcoin's relative reading. This modest difference may reflect the ongoing rotation interest that has driven ETH's monthly outperformance.
Key levels to monitor: the 7-day low at $2,636 is the immediate support, with the MA30 at $2,571 as the deeper structural floor. On the upside, the 7-day high at $2,749 and the 30-day high at $2,807 define the resistance zone. A sustained break above $2,749 would put the monthly peak back in play, while a loss of $2,636 would shift focus to the moving average.
Key Technical Levels
| Asset | Support | Resistance | RSI |
|---|---|---|---|
| BTC | $82,563 (7d low) / $80,707 (MA30) | $85,650 (7d high) / $87,396 (30d high) | 75.2 — overbought |
| ETH | $2,636 (7d low) / $2,571 (MA30) | $2,749 (7d high) / $2,807 (30d high) | 76.3 — overbought |
BTC vs ETH Dynamic
BTC and ETH are moving in near-lockstep today, with 24-hour changes of +0.20% and +0.17% respectively — a spread of just three basis points. That tight correlation extends across the weekly timeframe, where both assets are essentially flat (-0.73% for BTC, +0.09% for ETH), and it reflects a market driven by the same macro impulse rather than asset-specific narratives. The divergence appears over 30 days, where ETH's +12.48% comfortably beats BTC's +8.34%, suggesting that while the two assets rise and fall together on a daily basis, ETH has captured more of the upside during the broader September advance. Both are similarly overbought (75.2 vs 76.3) and both are seeing below-average volume (0.57x vs 0.67x), which reinforces the view that this is a consolidated, correlated pause rather than a rotation between the two. For traders, the practical implication is that directional bets on one asset are, at present, largely directional bets on the other.
Strategy Fit
Today's data presents a specific tactical profile: overbought RSI on both assets, price consolidating near 7-day moving averages, and volume running well below average. This is a low-volatility, range-bound environment at the daily level, even though the monthly trend remains upward. In such conditions, grid strategies — which profit from price oscillating within a defined band — tend to fit the observed structure, particularly given BTC's $3,087 weekly range and ETH's $113 weekly range. DCA (dollar-cost averaging) remains a natural approach for participants with a longer horizon who want to accumulate through consolidation without timing entries. Trend-following strategies are less aligned with today's flat 24-hour and 7-day prints, since they depend on directional expansion that the current volume profile does not support. Platforms like Pionex offer built-in bots — including grid trading and DCA bots — that are designed to operate in exactly these kinds of sideways, low-volume conditions, allowing users to automate execution around the technical levels identified above. The choice among them depends on individual risk tolerance and time horizon, not on any expectation about where price goes next.
Risk Disclaimer
This market recap is provided for informational purposes only and does not constitute financial, investment, or trading advice. The data and technical observations above describe past and current market conditions; they are not predictions of future price movement. Cryptocurrency markets are highly volatile and can result in the loss of all invested capital. RSI readings, moving averages, support and resistance levels, and volume metrics are descriptive tools, not guarantees. Nothing in this document should be construed as a recommendation to buy, sell, or hold any asset. Readers should conduct their own research and consult a qualified financial professional before making any investment decision. Past performance is not indicative of future results.
FAQ
What is Bitcoin's price on 2026-10-01?
BTC is trading at $83,791, up 0.20% over 24 hours, with an intraday range of $83,186 to $84,420.
Why are both BTC and ETH showing overbought RSI?
BTC's RSI(14) is 75.2 and ETH's is 76.3, both above the 70 threshold that conventionally marks overbought conditions. This reflects the strength of the September rally, during which BTC gained 8.34% and ETH gained 12.48% over 30 days.
What are the key support and resistance levels right now?
For BTC, support sits at $82,563 (7-day low) and $80,707 (MA30), with resistance at $85,650 (7-day high) and $87,396 (30-day high). For ETH, support is $2,636 (7-day low) and $2,571 (MA30), with resistance at $2,749 (7-day high) and $2,807 (30-day high).
Is trading volume high or low today?
Volume is below average for both assets. BTC is trading at 0.57x its 7-day average volume, and ETH is at 0.67x — indicating lighter participation during the current consolidation.
Which asset has performed better over the past month?
Ethereum has outperformed over 30 days with a +12.48% gain versus Bitcoin's +8.34%. Over the past 24 hours and 7 days, the two are nearly identical, with both essentially flat.


