BTC ETH Daily Recap — 2026-10-02

BTC ETH Daily Recap — 2026-10-02
Today at a Glance
Bitcoin closed the session at $86,573, up 1.99% over 24 hours after trading between $84,520 and $87,220. The move extends a constructive stretch that has BTC up 2.94% on the week and 6.52% on the month, with price now holding comfortably above both its 7-day moving average ($84,449) and 30-day moving average ($81,051). Momentum is firm — RSI(14) sits at 72.0 — while volume relative to the 7-day average printed 0.97x, essentially in line rather than climactic.
Ethereum followed with a 1.40% gain to $2,744, oscillating between $2,697 and $2,777. ETH is +1.96% over seven days and +9.44% over 30 days, trading above its MA7 ($2,698) and MA30 ($2,584). ETH's RSI(14) reads 68.8, and volume versus the 7-day average was 0.95x. Both assets sit near the upper end of their monthly ranges, with BTC roughly 1% below its 30-day high and ETH about 2.2% below its own.
Bitcoin Analysis
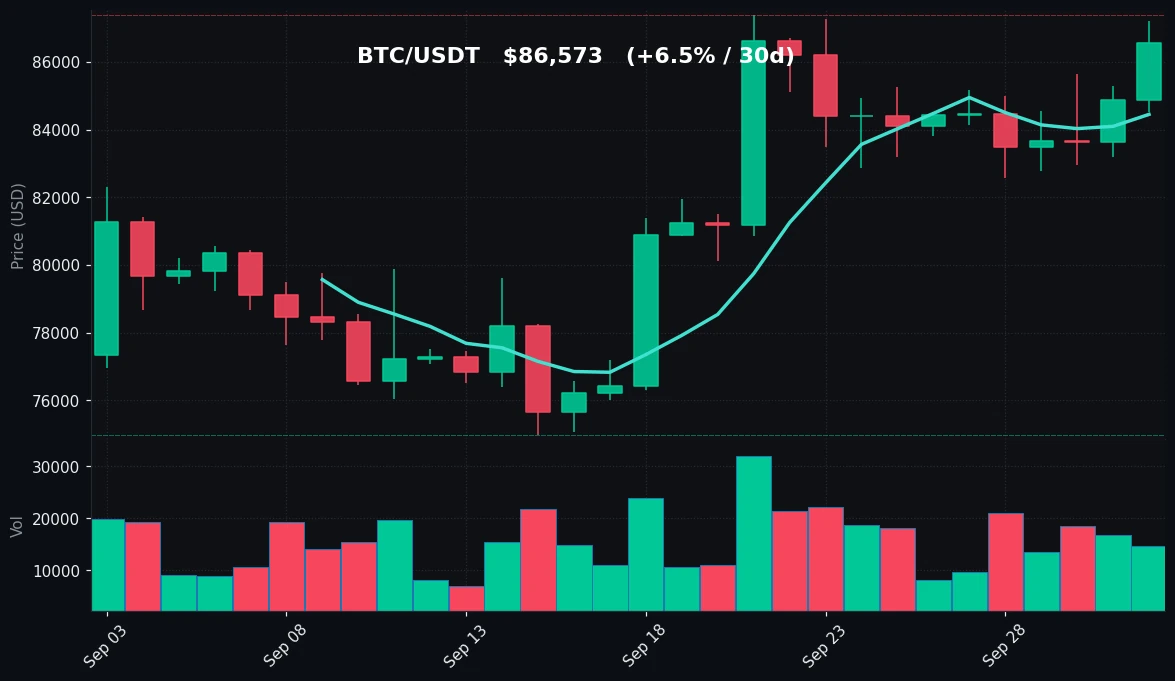
TradingView Live (4h)
Bitcoin's daily structure remains a clean, orderly uptrend. Price at $86,573 is positioned above the 7-day moving average of $84,449, which in turn sits above the 30-day moving average of $81,051 — a stacked configuration that has been in place through the recent advance. The gap between spot and MA7 is roughly $2,124, or about 2.5%, which is meaningful but not stretched relative to the +6.52% 30-day move. The more notable spread is between spot and MA30: $5,522, or approximately 6.8%, reflecting how much ground has been covered since the $74,968 monthly low.
On the session, BTC traded a $2,700 range from $84,520 to $87,220, a band of roughly 3.1% of spot. The close at $86,573 landed in the upper portion of that range, about 74% of the way from low to high. That positioning suggests buyers retained control into the close rather than fading the intraday advance. The 7-day high of $87,220 was set during this session, while the 7-day low of $82,563 is now roughly $4,010 below spot — a reminder that the past week included a drawdown of about 4.6% before the recovery.
The 30-day picture shows a high of $87,396 against the current $86,573, leaving BTC just 0.94% below its monthly peak. That proximity to the range top matters for how traders frame risk: upside continuation would mark a fresh 30-day high, while the $87,220–$87,396 zone represents a well-defined supply band. Below, the $84,449 MA7 is the first dynamic reference, followed by the $82,563 weekly low and then the $81,051 MA30.
Momentum, as measured by RSI(14) at 72.0, is in overbought territory by the conventional 70 threshold. Importantly, overbought readings in a trending market can persist, and the absence of a volume surge supports the idea that this is steady accumulation rather than an exhaustion spike. Volume at 0.97x the 7-day average is slightly below normal — a mild divergence from the price advance, though not an extreme one. In practical terms, the trend is intact, momentum is elevated, and the immediate technical question is whether the $87,220–$87,396 band absorbs supply or gives way. No directional call is warranted from this data alone; the observable facts are an uptrend, an overbought RSI, and normal-range volume.
Ethereum Analysis
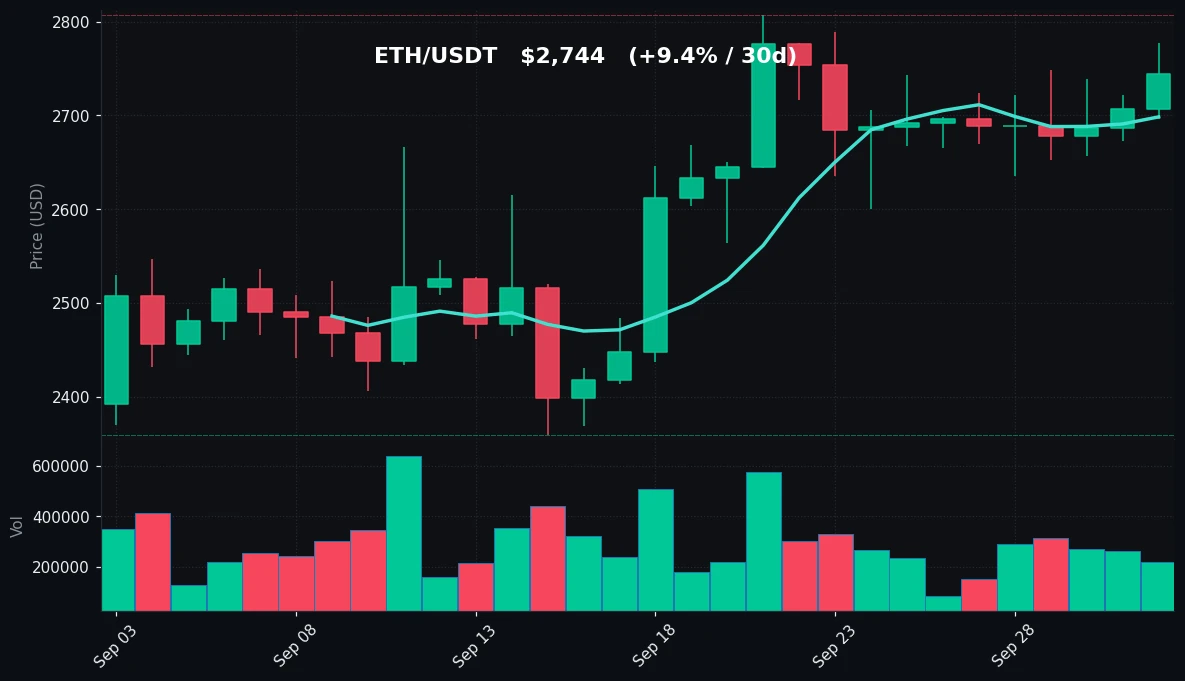
TradingView Live (4h)
Ethereum's setup mirrors Bitcoin's but with slightly softer momentum characteristics. At $2,744, ETH trades above its MA7 of $2,698 by about $46, or 1.7%, and above its MA30 of $2,584 by roughly $160, or 6.2%. The moving averages are stacked in bullish order — MA7 above MA30 — consistent with the +9.44% 30-day performance. Notably, ETH's 30-day gain outpaces BTC's +6.52%, indicating relative strength over the monthly window even though the daily move (+1.40%) lagged BTC's +1.99%.
The intraday range spanned $2,697 to $2,777, a band of $80, or about 2.9% of spot. The close at $2,744 sits roughly 59% up from the session low — a solid but less emphatic finish than BTC's. The 7-day high of $2,777 was touched during the session, and the 7-day low of $2,636 is now about $108 below spot, a 3.9% cushion from the weekly trough. Against the 30-day high of $2,807, ETH is 2.25% below the monthly peak, a slightly wider gap than BTC's 0.94%.
That relative positioning is worth noting. ETH has more room to run before challenging its monthly high, but it also closed further from its session high than BTC did. The $2,777 level stands as immediate resistance, coinciding with the 7-day high, while $2,807 marks the 30-day ceiling. On the downside, the $2,698 MA7 is the first structural support, with $2,636 and $2,584 (MA30) beneath it.
RSI(14) at 68.8 is below the 70 overbought line, placing ETH in a firm but not extended momentum regime — a notch cooler than BTC's 72.0. Volume at 0.95x the 7-day average is marginally lighter than BTC's 0.97x, suggesting similarly unremarkable participation. Taken together, ETH presents a constructive trend with momentum approaching but not crossing the overbought threshold, price above both key moving averages, and a defined resistance band at $2,777–$2,807. As with BTC, the data describes positioning rather than direction.
Key Technical Levels
| Asset | Support | Resistance | RSI |
|---|---|---|---|
| BTC | $84,449 (MA7) / $82,563 (7d low) / $81,051 (MA30) | $87,220 (7d high) / $87,396 (30d high) | 72.0 — overbought |
| ETH | $2,698 (MA7) / $2,636 (7d low) / $2,584 (MA30) | $2,777 (7d high) / $2,807 (30d high) | 68.8 — neutral to overbought |
BTC vs ETH Dynamic
BTC and ETH are moving in the same direction with comparable magnitude, reflecting the high correlation typical of large-cap crypto in trending conditions. BTC's 24-hour gain of 1.99% versus ETH's 1.40% shows Bitcoin leading on the day, while ETH's 30-day gain of 9.44% versus BTC's 6.52% shows Ethereum leading over the month — a rotation that suggests capital has broadened beyond BTC without abandoning it. Both assets closed above their MA7 and MA30, both printed volume just shy of their 7-day averages (0.97x and 0.95x), and both sit near the top of their monthly ranges. The shared structure implies that macro flows, rather than asset-specific catalysts, are the dominant driver right now.
Strategy Fit
With BTC's RSI at 72.0 and ETH's at 68.8, both assets are in elevated momentum territory while trading in defined ranges — BTC between roughly $82,563 and $87,396, ETH between $2,636 and $2,807. Volume near the 7-day average suggests orderly conditions rather than panic or euphoria. In such an environment, range-aware approaches tend to fit the observed data: grid strategies can capture oscillation within established bands, DCA suits accumulation during pullbacks toward moving-average support, and trend-following frameworks align with the stacked moving averages and higher-high structure. Pionex offers built-in bots — including grid trading, DCA, and trend-oriented configurations — that automate these approaches without requiring manual order management. The appropriate choice depends on individual risk tolerance and market view; the data here simply describes a trending market with elevated momentum and contained volatility.
Risk Disclaimer
This recap is provided for informational purposes only and does not constitute financial, investment, or trading advice. Cryptocurrency markets are highly volatile and can result in substantial or total loss of capital. Technical indicators such as RSI, moving averages, and volume ratios describe past price behavior and do not guarantee future results. Nothing in this document should be interpreted as a recommendation to buy, sell, or hold any asset. Readers should conduct their own research and consult a qualified financial professional before making any investment decision.
FAQ
What was Bitcoin's price on 2026-10-02?
BTC/USDT closed at $86,573, up 1.99% over 24 hours, with an intraday high of $87,220 and low of $84,520.
What was Ethereum's price on 2026-10-02?
ETH/USDT closed at $2,744, up 1.40% over 24 hours, with an intraday high of $2,777 and low of $2,697.
Are BTC and ETH overbought right now?
BTC's RSI(14) is 72.0, above the conventional 70 overbought threshold. ETH's RSI(14) is 68.8, just below it. RSI measures momentum and can remain elevated during sustained trends.
What are the key support and resistance levels?
BTC support sits at $84,449 (MA7), $82,563 (7-day low), and $81,051 (MA30), with resistance at $87,220 and $87,396. ETH support is at $2,698 (MA7), $2,636 (7-day low), and $2,584 (MA30), with resistance at $2,777 and $2,807.
How does volume compare to recent averages?
BTC volume was 0.97x its 7-day average and ETH volume was 0.95x, indicating participation slightly below recent norms for both assets.


