BTC ETH Daily Recap — 2026-10-08

BTC ETH Daily Recap — 2026-10-08
Today at a Glance
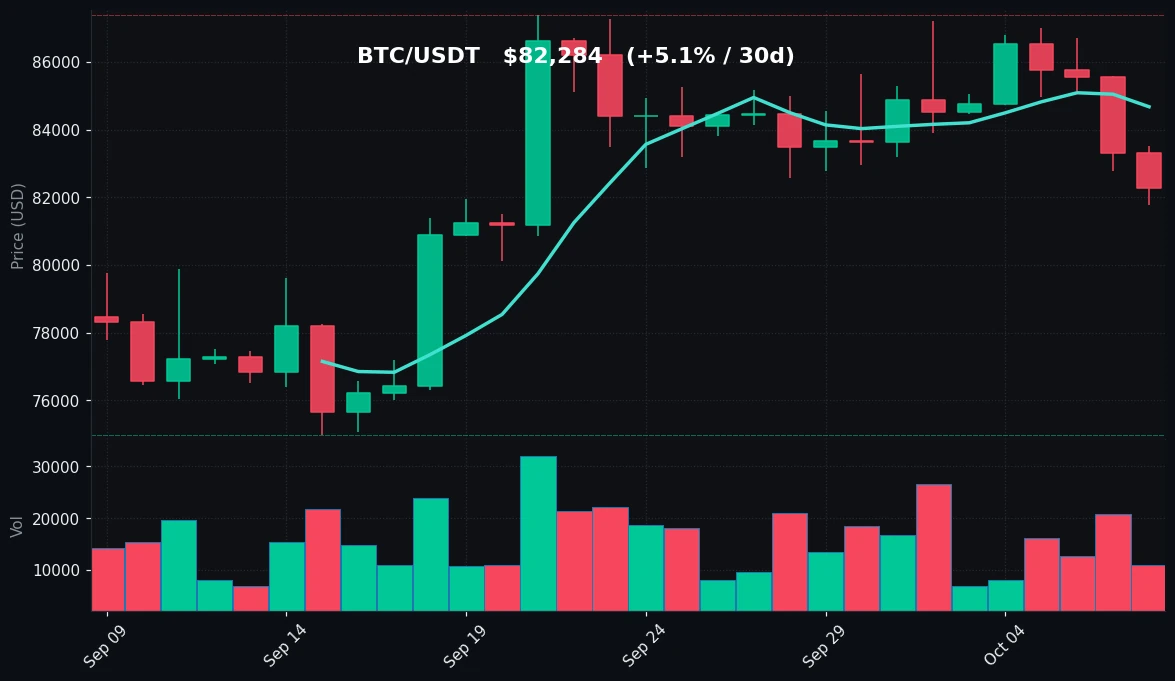
Bitcoin changed hands at $82,284, down 1.25% over the past 24 hours, trading inside a tight $81,773–$83,521 range. The move extends a softer stretch: BTC is -3.06% on the week but still +5.08% over 30 days, leaving it roughly 6% below the 7-day high of $87,220. Price is now below the MA7 ($84,675) but above the MA30 ($81,967), and RSI(14) sits at 39.1 — the weaker end of neutral. Volume ran at 0.72x the 7-day average, suggesting limited conviction behind the pullback.
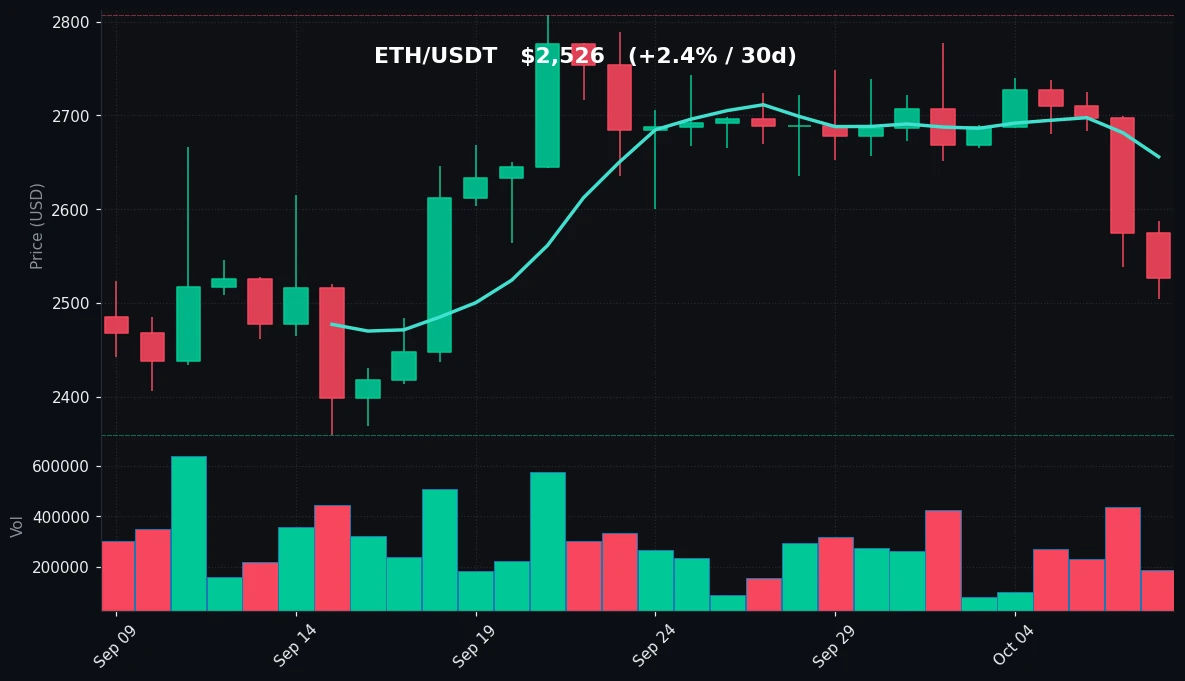
Ethereum was weaker still: $2,526, -1.86% on the day and -6.66% on the week, though +2.35% over 30 days. ETH printed a 7-day low of $2,504 and an RSI(14) of 27.0 — technically oversold. It trades below both its MA7 ($2,656) and MA30 ($2,614), with volume at 0.73x the 7-day average.
Bitcoin Analysis
TradingView Live (4h)
Bitcoin's session was defined by compression rather than expansion. The 24-hour range of $81,773–$83,521 is narrow relative to the 7-day span of $81,773–$87,220, and the fact that the daily low coincides exactly with the weekly low tells a specific story: sellers pushed price to the lower boundary of the recent structure, but did not break it. The close at $82,284 leaves BTC in the lower third of its weekly range, roughly 5.7% below the 7-day high and about 9.7% above the 30-day low of $74,968.
The moving-average picture is mixed but informative. The MA7 at $84,675 sits above spot, confirming that the short-term trend has rolled over — price has spent recent sessions below the fast average. The MA30 at $81,967, however, sits marginally below spot, meaning the medium-term trend line is still providing a floor. This MA7-above-price-above-MA30 configuration is characteristic of a pullback within a broader uptrend rather than a structural breakdown. The 30-day gain of +5.08% supports that framing: despite the weekly decline, BTC is still net higher over the month, having recovered from the $74,968 low.
Momentum is soft but not stretched. RSI(14) at 39.1 is below the 50 midline, indicating that recent closes have clustered in the lower half of the range, yet it remains well above the 30 threshold typically associated with oversold conditions. In other words, there is room for further cooling without a momentum extreme being reached — but equally, no oversold snapback signal is present.
Volume is the notable nuance. At 0.72x the 7-day average, participation is light. Declines on thinning volume are generally interpreted as a lack of aggressive selling rather than decisive distribution, though light volume also means the market is more susceptible to sharp moves on modest order flow. The immediate reference points are clear: $81,773 as the 7-day and 24-hour low, with the MA30 at $81,967 just above it forming a support cluster; to the upside, the MA7 at $84,675 is the first reclaim level, followed by the $87,220–$87,396 band that capped the 7- and 30-day highs.
Ethereum Analysis
TradingView Live (4h)
Ethereum's tape was more decisive than Bitcoin's, and not in a constructive direction. ETH closed at $2,526, down 1.86% on the day and 6.66% over seven days. The 24-hour range of $2,504–$2,587 was tight, but the daily low again matched the 7-day low at $2,504 — the same pattern of sellers testing the base of the range without yet forcing a breakdown. Relative to the 7-day high of $2,777, ETH is about 9% lower; relative to the 30-day low of $2,359, it is roughly 7% higher.
The moving-average structure is the key differentiator from BTC. ETH trades below both its MA7 ($2,656) and its MA30 ($2,614). Unlike Bitcoin, where the 30-day average still underpins price, Ethereum has lost its medium-term reference line. That is a weaker configuration: the short-term average is declining toward the medium-term average, and price is beneath both. The 30-day performance of +2.35% shows ETH is still marginally positive over the month, but the weekly decline of 6.66% has erased most of that cushion.
Momentum confirms the divergence. RSI(14) at 27.0 is below 30 — technically oversold, and roughly 12 points beneath Bitcoin's reading. This is the most concrete signal on the board: ETH has been sold persistently enough to register an oversold condition, whereas BTC has not. Oversold readings describe the speed and persistence of recent declines; they are not, on their own, reversal signals, and in strong downtrends RSI can remain depressed for extended periods.
Volume at 0.73x the 7-day average mirrors Bitcoin's light participation. The absence of a volume spike on the move to $2,504 suggests the decline has not been driven by capitulation-level selling, but it also means no high-volume absorption has been recorded at the lows.
Structurally, ETH is the weaker of the two majors today. The levels that matter are $2,504 as immediate support — a level now tested twice — with the 30-day low at $2,359 as the deeper reference. To the upside, ETH must first reclaim the MA30 at $2,614, then the MA7 at $2,656, before the $2,777–$2,807 zone comes back into view.
Key Technical Levels
| Asset | Support | Resistance | RSI |
|---|---|---|---|
| BTC | $81,773 (7d/24h low) / $81,967 (MA30) | $84,675 (MA7) / $87,220–$87,396 (7d/30d high) | 39.1 — neutral, lower half |
| ETH | $2,504 (7d/24h low) / $2,359 (30d low) | $2,614 (MA30) / $2,656 (MA7) / $2,777–$2,807 (7d/30d high) | 27.0 — oversold |
BTC vs ETH Dynamic
The two majors are moving in the same direction but at different velocities, and that gap is the defining feature of today's tape. Both declined, both closed near the lower end of their weekly ranges, and both did so on sub-0.75x average volume — a shared signature of a low-conviction, drift-lower session. But ETH's -6.66% weekly decline against BTC's -3.06% shows roughly double the downside beta over the same window, and the RSI spread (27.0 vs 39.1) quantifies that divergence. ETH has also lost its MA30 while BTC has not, meaning the correlation in direction is not matched by a correlation in structure. Historically, when ETH underperforms BTC on the downside, it tends to amplify moves in both directions — so the relative-strength gap is worth monitoring as a sentiment gauge rather than a standalone signal.
Strategy Fit
Today's conditions — compressed intraday ranges, below-average volume, and a market sitting between defined support and resistance — are the kind of environment where range-oriented approaches tend to be discussed more than breakout approaches. BTC's position between the $81,773 support cluster and the $84,675 MA7, combined with an RSI that is neither overbought nor oversold, describes a market oscillating inside a band. ETH's oversold RSI at 27.0 with price just above a twice-tested $2,504 low describes a different setup: a stretched move that may invite either mean-reversion interest or continued weakness.
For traders who favor systematic execution over directional calls, this type of tape is where grid strategies are typically considered — they are designed to place layered buy and sell orders within a defined range, collecting from oscillation rather than requiring a breakout. Pionex offers built-in grid trading bots that automate this process, alongside DCA bots for staggered accumulation and trend-following bots for markets that are moving directionally. The choice depends on the user's own read of whether the current range holds; the data above describes conditions, not outcomes, and no strategy is appropriate for every market state.
Risk Disclaimer
This article is for informational purposes only and does not constitute financial, investment, or trading advice. Nothing here is a recommendation to buy, sell, or hold any asset. Cryptocurrency markets are highly volatile and can result in the total loss of capital. Technical indicators such as RSI, moving averages, and volume ratios describe past price behavior and do not predict future results. Always conduct your own research and consult a qualified professional before making any financial decision.
FAQ
What price did BTC close at on 2026-10-08?
BTC traded at $82,284, down 1.25% over 24 hours, within a $81,773–$83,521 daily range.
Why is ETH's RSI different from BTC's?
ETH's RSI(14) is 27.0 (oversold) versus BTC's 39.1 (neutral, lower half). ETH has declined 6.66% over seven days against BTC's 3.06%, so its recent closes have clustered lower within its range.
What are the key support levels for BTC and ETH?
BTC support sits at $81,773 (7-day and 24-hour low) with the MA30 at $81,967 just above. ETH support is $2,504 (7-day and 24-hour low), with the 30-day low at $2,359 beneath it.
Is the low trading volume significant?
Volume is running at 0.72x the 7-day average for BTC and 0.73x for ETH. Light volume on a decline suggests limited aggressive selling, but it also means the market can move sharply on relatively small order flow.
Do these indicators predict where prices go next?
No. RSI, moving averages, and volume ratios are descriptive tools that summarize recent price and participation data. They do not forecast future prices, and this article contains no price predictions.


