BTC ETH Daily Recap — 2026-10-22

BTC ETH Daily Recap — 2026-10-22
Today at a Glance
Both major cryptocurrencies extended their recent pullback on October 22, 2026, with BTC and ETH posting synchronized declines across the 24-hour window. Bitcoin slipped 2.72% to $81,810, trading in a $3,001 range between $84,377 and $81,376, and now sits below both its 7-day ($82,299) and 30-day ($83,470) moving averages. Ethereum fell 2.45% to $2,413, with a tighter intraday band of $87 between $2,482 and $2,395. On a broader horizon, the divergence is notable: BTC is down just 0.53% over 7 days and 3.07% over 30 days, while ETH has lost 1.19% weekly and 10.12% monthly. Volume tells its own story — Bitcoin traded at 0.97x its 7-day average, essentially normal, while Ethereum's volume collapsed to 0.54x, indicating markedly thinner participation. RSI readings of 50.2 for BTC and 43.5 for ETH both sit in neutral territory, though ETH leans toward the weaker end of that band.
Bitcoin Analysis
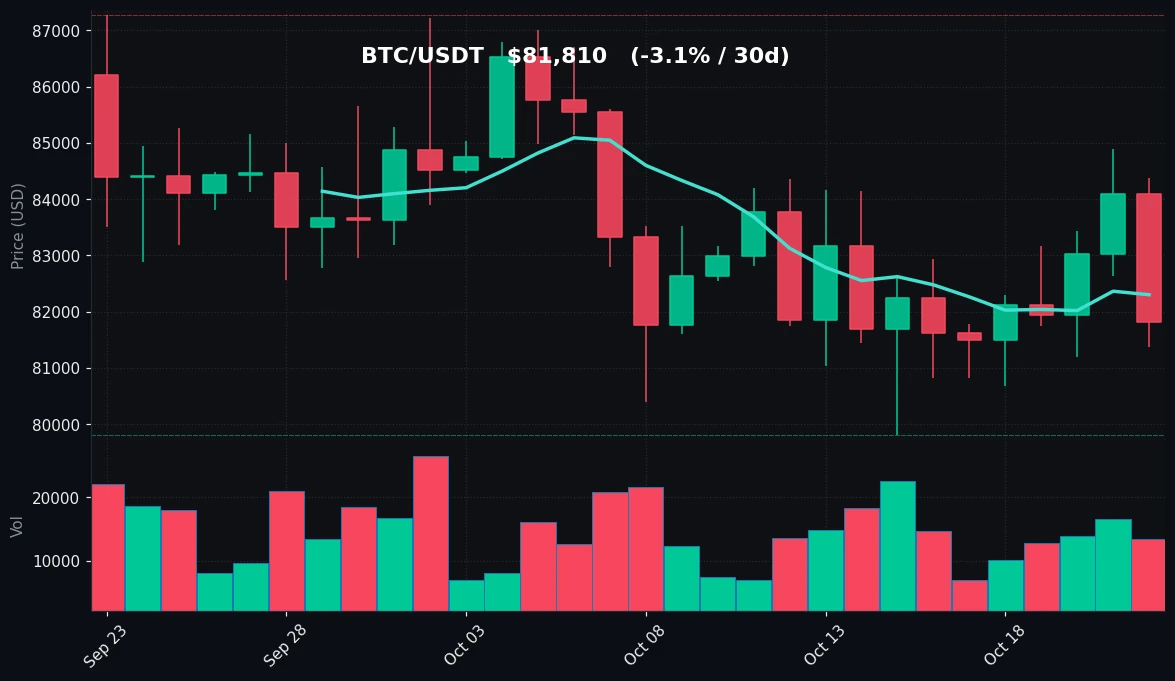
TradingView Live (4h)
Bitcoin's session on October 22 was defined by a rejection from the upper $84K region and a slide toward the lower $81K area. Price opened the day near the $84,377 high, failed to hold, and pressed down to $81,376 before settling at $81,810 — a session that closed near its lows and well beneath the day's midpoint. This intraday weakness fits into a slightly negative short-term structure: the 7-day change of -0.53% is modest, but the 30-day change of -3.07% shows a gradual drift lower rather than a sharp correction.
The moving average configuration is instructive. BTC's price of $81,810 sits below the MA7 of $82,299 and the MA30 of $83,470, placing the spot price beneath both short- and medium-term trend references. The MA7 has also crossed beneath the MA30 in level terms, a configuration that reflects the recent loss of upward momentum. That said, the gap between price and the MA30 is only about $1,660, or roughly 2%, so the market is not deeply extended to the downside.
Key technical levels are well defined by recent price action. On the support side, the 7-day low of $80,684 is the first meaningful floor, followed by the 30-day low of $79,800 — the latter being the more significant structural level, as it marks the lower boundary of the monthly range. Resistance is stacked above: the MA7 at $82,299 is the immediate hurdle, then the MA30 at $83,470, the 24-hour high at $84,377, and finally the 7-day high of $84,898. The 30-day high of $87,279 remains the upper bound of the broader range.
Volume behavior is neutral. Trading at 0.97x the 7-day average means the decline was not accompanied by a volume surge — there was no capitulation-style selling, but equally no aggressive accumulation on the dip. This is consistent with a market in consolidation rather than one undergoing a directional breakout.
The RSI(14) at 50.2 is the clearest signal of balance. Sitting almost precisely at the midpoint, momentum is neither stretched to the upside nor oversold. There is ample room in either direction before momentum extremes become a factor. Taken together, BTC is in a neutral-to-soft consolidation phase, trading within a well-established $79,800–$87,279 monthly range, with the near-term bias defined by whether price can reclaim the $82,299–$83,470 moving average cluster.
Ethereum Analysis
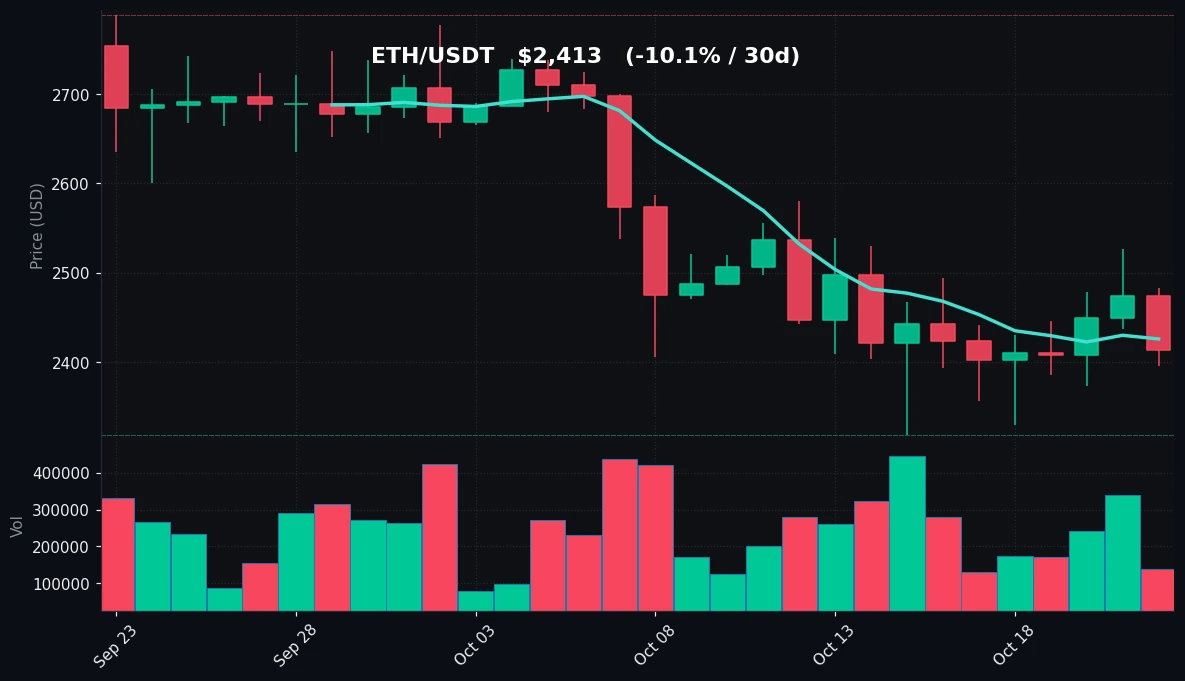
TradingView Live (4h)
Ethereum's October 22 session was weaker in both absolute and relative terms. ETH fell 2.45% to $2,413, trading between $2,482 and $2,395 — a range of just $87, or roughly 3.6% of price, indicating a controlled but persistent decline. Unlike Bitcoin, ETH closed the session closer to the middle of its range rather than at the lows, but the broader trend context is considerably more negative.
The 30-day performance is the headline: ETH is down 10.12% over the month, compared with BTC's 3.07% decline. That divergence of roughly seven percentage points underscores a persistent relative weakness in the second-largest asset. The 7-day change of -1.19% is also worse than BTC's -0.53%. The 30-day high of $2,789 versus the current price of $2,413 represents a drawdown of approximately 13.5% from the monthly peak, and the 30-day low of $2,318 sits only about $95 below current levels — a narrow buffer.
The moving average picture reinforces the bearish tilt. ETH trades below the MA7 of $2,426 and well below the MA30 of $2,569. The distance to the MA30 — roughly $156, or 6.5% — is notably wider than Bitcoin's equivalent gap, signaling that ETH is more extended below its medium-term trend anchor. The MA7 at $2,426 is just $13 above spot, making it an immediate and close resistance level.
Technical levels are tightly clustered. Support rests at the 24-hour low of $2,395, then the 7-day low of $2,329, and the 30-day low of $2,318 — three levels within a $77 band, suggesting a dense support zone in the $2,318–$2,395 area. Resistance begins at the MA7 ($2,426), then the 24-hour high ($2,482), the 7-day high ($2,527), and the MA30 ($2,569), with the 30-day high of $2,789 as the range ceiling.
Volume is the standout data point. At 0.54x the 7-day average, ETH trading volume is barely half of its recent norm. This thin participation cuts both ways: it means the decline has occurred on light selling pressure, but it also means there is little conviction behind any move, and low-liquidity conditions can amplify volatility in either direction.
The RSI(14) of 43.5 is in neutral territory but tilted toward the weaker half of the range. It is not oversold — there is still room to fall before momentum reaches an extreme — but it confirms the absence of buying momentum. ETH's structure is best characterized as a controlled downtrend within a $2,318–$2,789 monthly range, with price in the lower third and facing a wall of nearby resistance.
Key Technical Levels
| Asset | Support | Resistance | RSI |
|---|---|---|---|
| BTC | $80,684 (7d low) / $79,800 (30d low) | $82,299 (MA7) / $83,470 (MA30) / $84,898 (7d high) | Neutral (50.2) |
| ETH | $2,395 (24h low) / $2,329 (7d low) / $2,318 (30d low) | $2,426 (MA7) / $2,527 (7d high) / $2,569 (MA30) | Neutral (43.5) |
BTC vs ETH Dynamic
The two largest assets moved in the same direction on October 22, with BTC down 2.72% and ETH down 2.45% — a tight intraday correlation that reflects the shared macro and sentiment drivers pushing the complex lower. However, the correlation breaks down over longer horizons. BTC's 30-day decline of 3.07% is less than a third of ETH's 10.12% drop, and the volume profiles diverge sharply: BTC traded at 0.97x its 7-day average while ETH managed only 0.54x. This suggests capital is rotating toward Bitcoin relative to Ethereum, or at minimum that ETH is experiencing an outflow of trading interest. The practical read is that ETH is currently the higher-beta, weaker leg of the pair — it has fallen further and trades further below its medium-term moving average — while BTC retains a more balanced structure and holds a larger cushion above its monthly low.
Strategy Fit
Today's conditions — neutral RSI readings, price consolidating within established ranges, and volume at or below average — are characteristic of a range-bound market rather than a trending one. For BTC, the well-defined $79,800–$87,279 monthly range and near-midpoint RSI make grid-style strategies a natural fit, as grids are designed to harvest volatility within a defined band. ETH's tighter, denser support zone and low volume suggest a similar but more cautious approach, given its weaker trend. Dollar-cost averaging remains a reasonable framework for participants seeking to build positions gradually through consolidation, while trend-following strategies have less to work with given the absence of a clear directional breakout and the fact that both assets trade below their key moving averages. Pionex offers built-in bots — including grid trading and DCA bots — that are designed to operate in exactly these kinds of range-bound conditions, allowing users to automate execution within self-defined parameters. Strategy selection should always match individual risk tolerance and market conditions, which can change quickly.
Risk Disclaimer
This market recap is provided for informational purposes only and does not constitute financial advice, investment advice, or a recommendation to buy or sell any asset. Cryptocurrency markets are highly volatile and can result in the loss of principal. The data and analysis presented reflect conditions as of October 22, 2026, and are subject to change. Past performance is not indicative of future results. Readers should conduct their own research and consult a qualified financial professional before making any investment decisions.
FAQ
What was Bitcoin's price on October 22, 2026?
Bitcoin traded at $81,810, down 2.72% over 24 hours, with an intraday range between $84,377 and $81,376.
How did Ethereum perform on the same day?
Ethereum fell 2.45% to $2,413, trading between $2,482 and $2,395. Over 30 days, ETH is down 10.12%.
What do the RSI readings indicate?
BTC's RSI(14) of 50.2 and ETH's 43.5 both sit in neutral territory. Neither asset is overbought or oversold, though ETH leans toward the weaker end of the neutral band.
Which asset is relatively stronger?
Bitcoin is relatively stronger: it is down only 3.07% over 30 days versus ETH's 10.12%, and it trades closer to its moving averages with normal volume participation.
What are the key support levels to watch?
For BTC, the 7-day low of $80,684 and 30-day low of $79,800 are the primary supports. For ETH, the $2,318–$2,395 zone represents a dense cluster of support levels.


