BTC ETH Daily Recap — 2026-10-06

BTC ETH Daily Recap — 2026-10-06
Today at a Glance
Bitcoin is trading at $86,325, up +0.65% over the past 24 hours, with an intraday range of $85,136 to $86,488. On a weekly basis, BTC is +3.18%, and over 30 days it is +9.12%. The asset remains above both its 7-day moving average ($85,200) and 30-day moving average ($81,725), keeping the broader structure constructive. RSI(14) sits at 50.7 — squarely neutral — while volume is running at just 0.47x the 7-day average, suggesting a quiet consolidation session.
Ethereum is at $2,713, up a modest +0.12% on the day, having traded between $2,690 and $2,724. ETH is +1.32% over 7 days and +8.96% over 30 days, and holds above its MA7 ($2,700) and MA30 ($2,610). Notably, ETH's RSI(14) is 41.7, leaning toward the weaker side of neutral, with volume at 0.40x the 7-day average — even lighter than BTC's. Both majors are drifting in low-volume ranges near recent highs.
Bitcoin Analysis
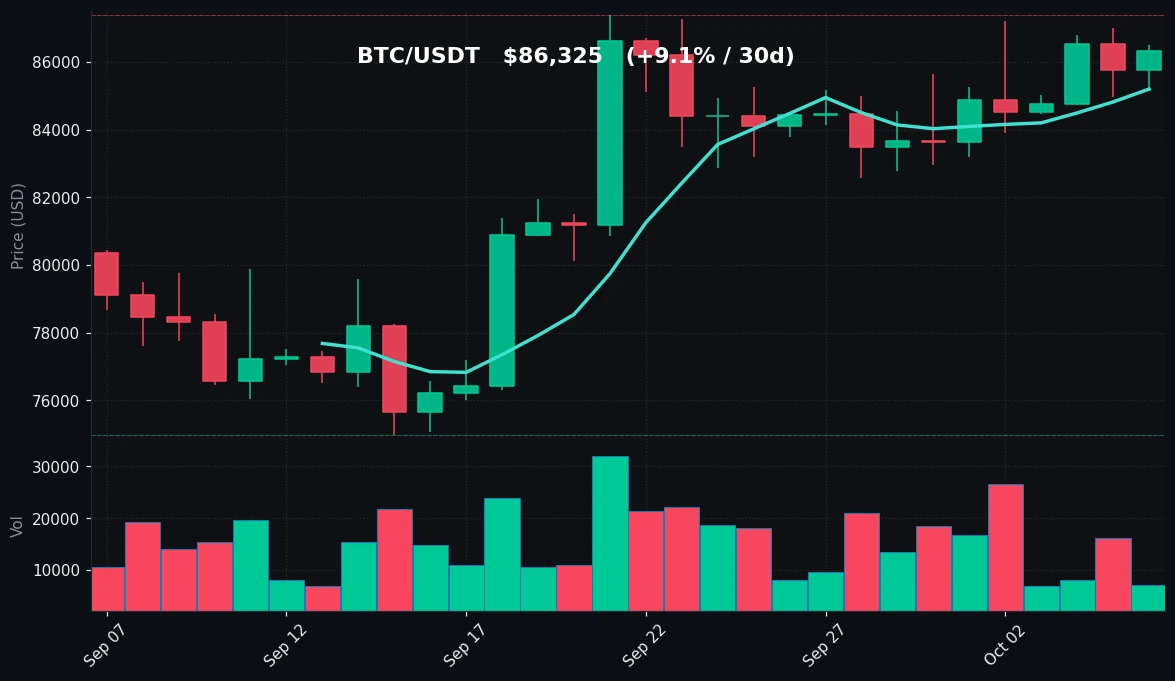
TradingView Live (4h)
Bitcoin's trend structure remains firmly constructive on the daily timeframe. Price at $86,325 sits comfortably above the 7-day moving average of $85,200 and well above the 30-day moving average of $81,725, with the shorter MA positioned above the longer MA — a classic bullish stacking that has persisted through the recent advance. The 30-day range shows a low of $74,968 and a high of $87,396, meaning BTC is currently trading in the upper portion of that band, roughly 1.2% below the 30-day peak. The 7-day high of $87,220 and low of $82,956 frame the more immediate consolidation zone.
On the daily candle, the +0.65% gain is modest and the intraday range of $85,136–$86,488 is relatively tight — about 1.6% of spot price. That compression near the upper end of the monthly range indicates the market is digesting gains rather than distributing them, though the absence of strong follow-through buying is notable. The immediate technical reference points are clear: resistance clusters around the $87,220–$87,396 zone (the 7-day and 30-day highs), while support is layered at the MA7 near $85,200, followed by the 7-day low at $82,956 and the MA30 at $81,725.
Momentum is neutral. RSI(14) at 50.7 means the indicator is essentially at its midpoint — neither overbought nor oversold — and it has room to move in either direction before hitting traditional extremes. This is consistent with a market that has already priced in a meaningful 30-day advance (+9.12%) and is now waiting for a catalyst.
The most telling data point today is volume. At 0.47x the 7-day average, participation is less than half of the recent norm. Low-volume drift near highs can reflect healthy consolidation, but it also means the current price is not strongly validated by trading activity. In practical terms, thin volume reduces the reliability of breakout or breakdown signals until volume expands. For now, BTC's technical picture is best described as a constructive uptrend in a low-conviction pause: higher highs and higher lows on the monthly view, neutral momentum, and a market that is holding gains without yet committing to the next directional move.
Ethereum Analysis
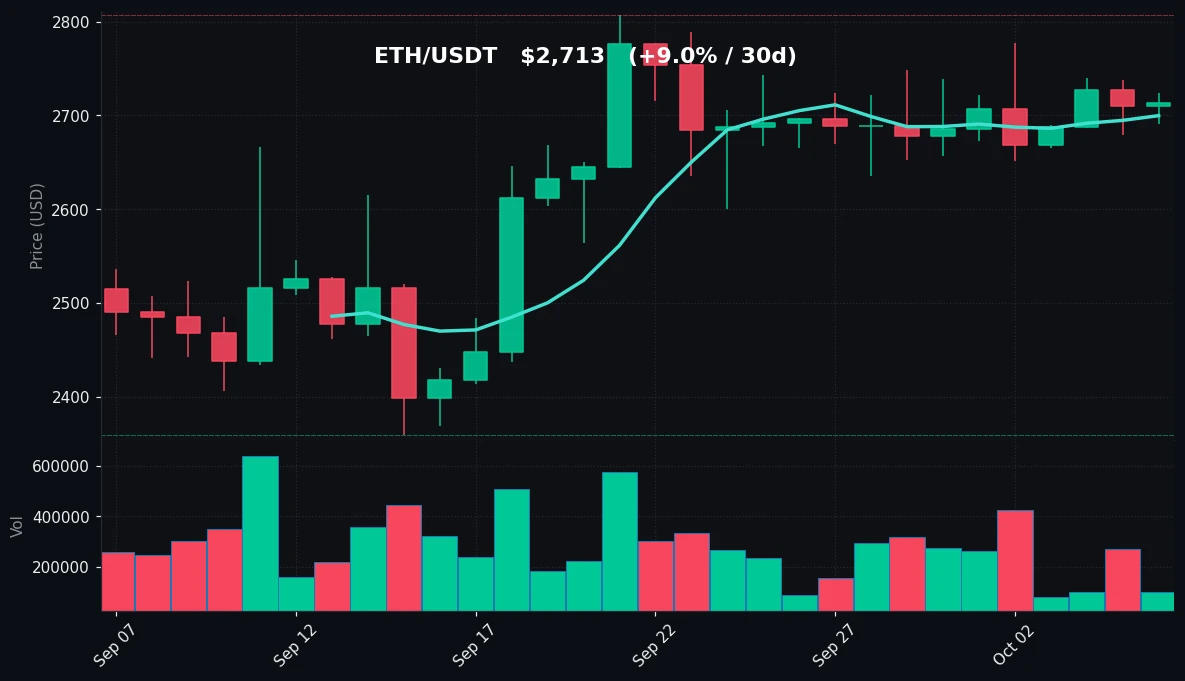
TradingView Live (4h)
Ethereum's structure is similar to Bitcoin's but visibly softer in momentum terms. At $2,713, ETH trades above its 7-day moving average of $2,700 — but only barely, with a margin of roughly 0.5%. It sits more comfortably above the 30-day moving average of $2,610, about 4% higher. The 30-day range spans a low of $2,359 to a high of $2,807, placing current price near the upper end of the monthly band, approximately 3.3% below the 30-day high. The 7-day high of $2,777 and low of $2,651 define the nearer-term envelope.
Today's session is notably quiet: +0.12% on the day, with a range of $2,690–$2,724 — a span of just 1.25% of spot. ETH is effectively flat, pinned close to its MA7. The key levels are straightforward. On the downside, the MA7 at $2,700 is the first line of support, followed by the 7-day low at $2,651 and then the MA30 at $2,610. On the upside, resistance sits at the 7-day high of $2,777 and the 30-day high of $2,807.
The momentum reading is the standout detail: RSI(14) at 41.7 is below the midpoint and closer to oversold territory than overbought, even as price holds near monthly highs. This divergence — price near range highs while RSI leans weak — suggests that the recent climb has lost momentum and that ETH is consolidating with a downward-tilting bias in momentum terms. It is not a breakdown signal on its own, but it does indicate that buyers have not been aggressive at these levels.
Volume reinforces the picture: at 0.40x the 7-day average, ETH trading activity is even thinner than BTC's. Combined with the weak RSI and the tight daily range, the data describes a market in a low-participation holding pattern. ETH has kept pace with BTC over 30 days (+8.96% vs +9.12%) but has lagged over 7 days (+1.32% vs +3.18%), and the soft RSI suggests that relative underperformance could persist until either volume returns or price reclaims the $2,777 area with conviction. Until then, the technical posture is neutral-to-cautious within an intact broader uptrend.
Key Technical Levels
| Asset | Support | Resistance | RSI |
|---|---|---|---|
| BTC | $85,200 (MA7) / $82,956 (7d low) / $81,725 (MA30) | $87,220 (7d high) / $87,396 (30d high) | 50.7 — neutral |
| ETH | $2,700 (MA7) / $2,651 (7d low) / $2,610 (MA30) | $2,777 (7d high) / $2,807 (30d high) | 41.7 — neutral (weaker half) |
BTC vs ETH Dynamic
BTC and ETH remain directionally aligned, with both majors holding above their 7-day and 30-day moving averages and both sitting in the upper portion of their 30-day ranges. The correlation is evident in the shared pattern of low-volume consolidation near recent highs. However, the relative-strength picture has tilted toward Bitcoin over the past week: BTC is +3.18% on 7 days versus ETH's +1.32%, and BTC's RSI of 50.7 sits at the neutral midpoint while ETH's 41.7 leans into the weaker half of the range. Both assets are seeing subdued participation — BTC at 0.47x and ETH at 0.40x their respective 7-day volume averages — so neither is demonstrating decisive leadership today. The practical takeaway is that the pair is moving as a unit, but momentum is concentrating slightly more in BTC, and ETH would need to reclaim its 7-day high at $2,777 to close that gap.
Strategy Fit
Today's conditions — narrow intraday ranges, neutral RSI readings, and volume at roughly 0.4–0.5x the 7-day average — are characteristic of a range-bound, low-volatility session rather than a strong directional trend. In such environments, mean-reversion and accumulation approaches tend to fit the tape better than momentum-chasing entries. Grid strategies, which profit from price oscillating within a defined band, are structurally suited to this kind of compression; BTC's recent $82,956–$87,396 envelope and ETH's $2,651–$2,807 envelope provide natural reference ranges. Dollar-cost averaging (DCA) also fits a neutral-momentum, low-conviction backdrop, as it avoids the need to time entries during thin liquidity. Trend-following strategies, by contrast, have less to work with today given the lack of volume confirmation behind price. For traders who prefer automation, Pionex offers built-in bots — including grid trading and DCA bots — that can execute these approaches without manual order management. The choice between them depends on individual risk tolerance and timeframe, and none of these observations constitute a recommendation.
Risk Disclaimer
This article is for informational purposes only and does not constitute financial, investment, or trading advice. Cryptocurrency markets are highly volatile and can result in the loss of all invested capital. The data and technical observations presented here reflect a single point in time and may change rapidly. Always conduct your own research and consult a qualified professional before making any investment decision.
FAQ
What is Bitcoin's price today?
BTC is trading at $86,325, up +0.65% over the past 24 hours, with a daily high of $86,488 and low of $85,136.
What is Ethereum's price today?
ETH is trading at $2,713, up +0.12% over the past 24 hours, with a daily high of $2,724 and low of $2,690.
What do the RSI readings indicate?
BTC's RSI(14) is 50.7 and ETH's is 41.7. Both are in neutral territory, though ETH's reading leans toward the weaker half of the range, indicating softer momentum.
Why is volume so low today?
BTC volume is at 0.47x and ETH at 0.40x their 7-day averages. This reflects reduced participation and a consolidation phase rather than a directional breakout.
Which strategies suit current conditions?
With narrow ranges and neutral momentum, grid and DCA approaches are commonly associated with range-bound, low-volume markets. Pionex provides built-in bots for both. This is not financial advice.


