BTC ETH Daily Recap — 2026-10-03

BTC ETH Daily Recap — 2026-10-03
Today at a Glance
Bitcoin enters the October 3 session trading at $84,813, up 0.35% over 24 hours, with an intraday range of just $84,456 to $84,962 — a spread of roughly 0.6%, one of the tighter ranges of the past week. The move keeps BTC modestly positive across all tracked windows: +0.45% on 7 days and +6.47% on 30 days. Notably, volume is running at only 0.22x the 7-day average, a sharp contraction that suggests participation has thinned rather than conviction building.
Ethereum trades at $2,680, up 0.44% on the day but still down 0.60% over the past week. ETH's 30-day gain of 9.14% outpaces BTC's over the same period, though its 7-day high of $2,777 now sits nearly $100 above spot. ETH volume is even lighter, at 0.19x its 7-day average, with a 24-hour range of only $2,666 to $2,688.
Both assets are holding above their short- and medium-term moving averages, but the defining feature of today's tape is compression and low liquidity, not momentum.
Bitcoin Analysis
TradingView Live (4h)
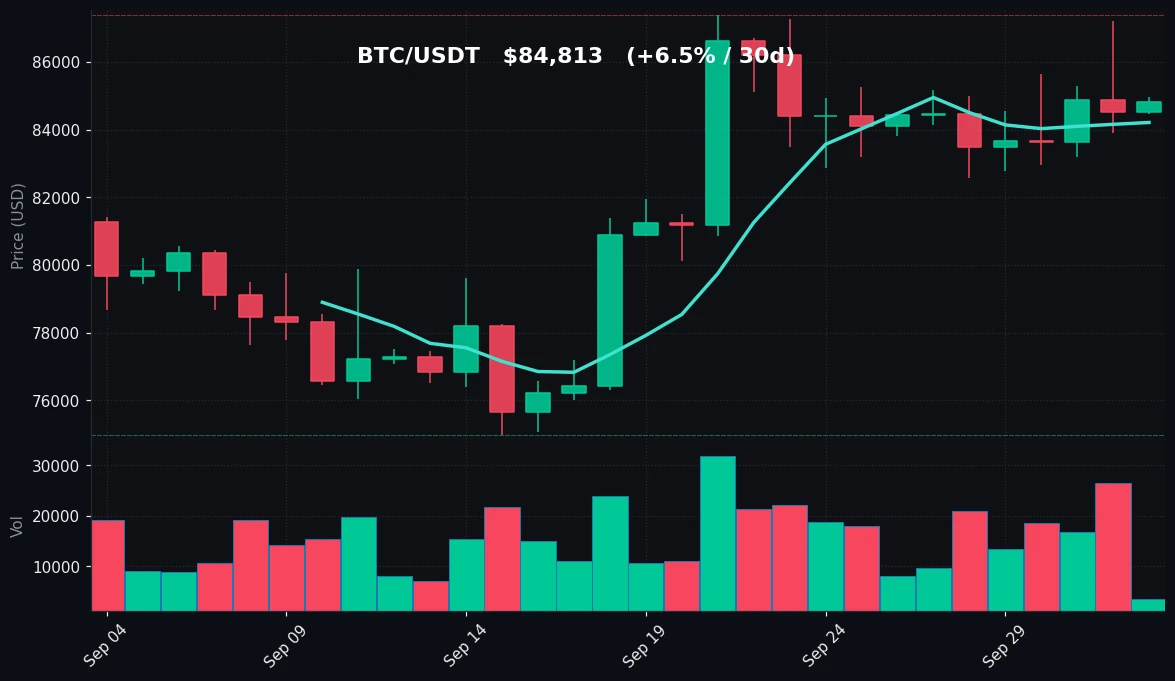
Bitcoin's daily structure remains constructive, but the texture of the move has changed. Price at $84,813 sits above both the MA7 at $84,210 and the MA30 at $81,101, a stacked alignment that has persisted for much of the past month. The 30-day range tells the fuller story: a low of $74,968 and a high of $87,396, meaning BTC has recovered roughly $9,800 from its monthly trough and is now consolidating about $2,583 below the monthly peak.
The immediate technical picture is one of a market that has advanced and is now digesting that advance. The 7-day high of $87,220 marks the nearest reference point for recent upside rejection, while the 7-day low of $82,563 defines the lower boundary of the current consolidation band. Today's session is unusually narrow — a $506 spread between high and low — and sits almost exactly between those two weekly extremes. That positioning suggests BTC is in a pause rather than a directional phase.
Momentum reads as firm but not stretched. RSI(14) at 65.5 is in bullish territory and approaching, but not reaching, the traditional 70 overbought threshold. Combined with price holding above both moving averages, the indicator describes an uptrend that retains room before momentum becomes a caution flag. Importantly, an RSI in the mid-60s during a low-volatility session is more consistent with steady absorption of supply than with an imminent exhaustion event.
The volume data is the most striking input. At 0.22x the 7-day average, participation is dramatically below recent norms. Low volume during consolidation can reflect either healthy supply absorption — holders unwilling to sell into strength — or simple apathy ahead of a catalyst. What it does not do is confirm a breakout or a breakdown. Until volume expands, the $82,563–$87,220 weekly band is the operative frame, with the MA7 at $84,210 acting as an intraday pivot that price is currently respecting from above.
For now, BTC's trend is intact, its momentum is positive-but-unconfirmed, and its volatility is compressed. The market is coiling, not resolving.
Ethereum Analysis
TradingView Live (4h)
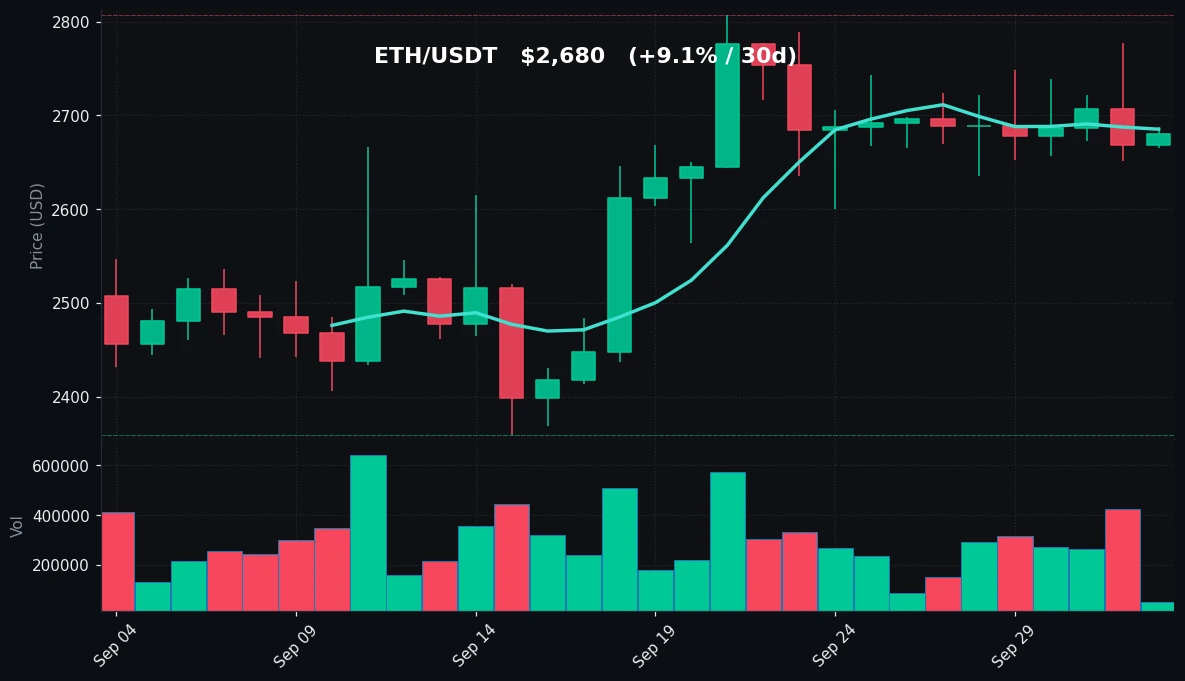
Ethereum's setup is subtly different from Bitcoin's. At $2,680, ETH is essentially pinned to its MA7 of $2,685 — trading a hair below it — while standing comfortably above the MA30 at $2,587. That divergence between the two averages is the key structural detail: the short-term trend has flattened out even as the medium-term trend remains clearly upward.
The weekly and monthly ranges frame the tension. Over 30 days, ETH rallied from $2,359 to a high of $2,807, a gain of roughly 19% peak-to-trough, and it retains a +9.14% net 30-day return. But the past 7 days have given back a modest 0.60%, with the 7-day high at $2,777 and low at $2,636. In other words, ETH's monthly strength is intact, but the most recent week has been a mild pullback and sideways drift rather than continued ascent. Price is currently in the lower-middle portion of the weekly range, about $97 below the weekly high and $44 above the weekly low.
RSI(14) at 56.9 reflects this cooling. It is a neutral reading — above the 50 midline, signaling that the broader uptrend hasn't broken, but well below BTC's 65.5 and far from overbought. The gap between the two assets' RSI is meaningful: BTC carries more relative momentum right now, while ETH is mid-consolidation.
Volume reinforces the quiet tone. At 0.19x the 7-day average, ETH's participation is even lighter than BTC's, and its 24-hour range of just $22 ($2,666–$2,688) is extraordinarily tight. Thin volume inside a tight range typically precedes a volatility expansion, though direction is not implied by the compression itself.
Structurally, ETH's line in the sand is the MA7 at $2,685 — reclaiming and holding above it would signal the short-term trend reasserting itself, while the MA30 at $2,587 is the deeper support that defines the medium-term uptrend. Between those levels, price is in a neutral zone with a slight bullish bias inherited from the monthly move.
Key Technical Levels
| Asset | Support | Resistance | RSI |
|---|---|---|---|
| BTC | $82,563 (7d low) / $84,210 (MA7) | $87,220 (7d high) / $87,396 (30d high) | 65.5 — neutral, approaching overbought |
| ETH | $2,636 (7d low) / $2,685 (MA7) | $2,777 (7d high) / $2,807 (30d high) | 56.9 — neutral |
BTC vs ETH Dynamic
BTC and ETH are moving in the same direction today but at different intensities, and the divergence in their 7-day and 30-day returns is the more informative signal. Over 30 days, ETH's +9.14% outruns BTC's +6.47%, indicating that ETH captured more of the prior month's upside. Over the past 7 days, however, that relationship flips: BTC is +0.45% while ETH is -0.60%, meaning BTC has held its gains more effectively during the current consolidation. The RSI spread — 65.5 for BTC versus 56.9 for ETH — confirms that BTC carries the stronger relative momentum right now. Both assets share the same low-volume condition (0.22x and 0.19x respectively), so the correlation remains high in direction, but capital appears to be rotating modestly toward BTC on a relative-strength basis this week. Neither asset is showing decoupling; this is a matter of degree, not divergence.
Strategy Fit
Today's conditions — compressed ranges, sub-average volume, and RSI readings in the neutral-to-upper-neutral band — are not a trend-following environment. BTC's $506 daily range and ETH's $22 range offer little room for directional strategies to capture meaningful moves, and the absence of volume means breakouts lack confirmation. This is a market that rewards patience and range-aware execution over momentum chasing.
For range-bound conditions like these, grid strategies tend to fit the tape: they monetize oscillation within a defined band (for BTC, roughly $82,563–$87,220; for ETH, $2,636–$2,777) without requiring a directional call. DCA approaches also remain relevant for longer-horizon participants, since both assets hold above their MA30 and the medium-term structure is still upward — periodic accumulation smooths entry across the consolidation rather than trying to time a single point. Trend-following strategies are the least suited today, given the lack of volume confirmation and the narrow intraday spreads.
Pionex offers built-in bots that map directly onto these conditions — grid trading bots for range-bound markets and DCA bots for scheduled accumulation — alongside futures grid options for those trading with leverage. The platform's automation is designed so that parameters can be set around the technical levels identified above rather than requiring constant manual adjustment. Matching the tool to the regime, rather than forcing a strategy onto an incompatible tape, is the practical takeaway.
Risk Disclaimer
This market recap is provided for informational purposes only and does not constitute financial, investment, or trading advice. Nothing in this document should be interpreted as a recommendation to buy, sell, or hold any asset. Cryptocurrency markets are highly volatile and carry substantial risk, including the potential loss of all invested capital. Technical indicators, moving averages, and support/resistance levels described here are historical observations, not predictions of future price behavior. Past performance is not indicative of future results. Readers should conduct their own research and consult a qualified financial professional before making any investment decision. Automated trading bots, including those referenced above, do not guarantee profits and can incur losses. You are solely responsible for your own trading decisions.
FAQ
What price is Bitcoin trading at on 2026-10-03?
BTC/USDT is at $84,813, up 0.35% over 24 hours, with a daily high of $84,962 and low of $84,456.
How has Ethereum performed over the past 30 days?
ETH is up 9.14% over 30 days, trading at $2,680, with a 30-day range of $2,359 to $2,807.
What do the RSI readings indicate for BTC and ETH?
BTC's RSI(14) is 65.5 and ETH's is 56.9. Both are in neutral territory — above the 50 midline but below the 70 overbought threshold — with BTC carrying the stronger relative momentum.
Why is trading volume so low today?
BTC volume is at 0.22x its 7-day average and ETH at 0.19x. This indicates reduced participation, which compresses ranges and means current price action lacks strong volume confirmation in either direction.
Which trading strategies suit the current market conditions?
With narrow ranges, low volume, and neutral RSI readings, range-based approaches like grid trading and scheduled accumulation like DCA tend to fit better than trend-following. Pionex provides built-in grid and DCA bots that can be configured around the technical levels outlined above.


