BTC ETH Daily Recap – July 10, 2026

BTC ETH Daily Recap – July 10, 2026
Today at a Glance
On July 10, 2026, Bitcoin (BTC) and Ethereum (ETH) both posted positive daily gains, continuing a week-long upward trend. BTC rose 2.00% over the past 24 hours, trading at $64,492 after touching a daily high of $64,693 and a low of $62,926. The asset’s 7-day gain stands at +3.05%, while its 30-day change is a more modest +1.36%. Ethereum outperformed Bitcoin on the day, gaining 3.36% to reach $1,804, with a daily range of $1,738 to $1,812. ETH’s 7-day and 30-day performances are stronger than BTC’s, at +2.60% and +7.79%, respectively. Volume for both assets is below their 7-day averages—BTC at 0.66x and ETH at 0.57x—suggesting cautious participation despite the price advances. The Relative Strength Index (RSI) for BTC sits at 68.0, nearing overbought territory, while ETH’s RSI of 76.0 has already crossed into overbought levels. Key moving averages (MA7 and MA30) for both assets remain in bullish alignment, with prices above them, indicating sustained short-term upward momentum.
Bitcoin Analysis
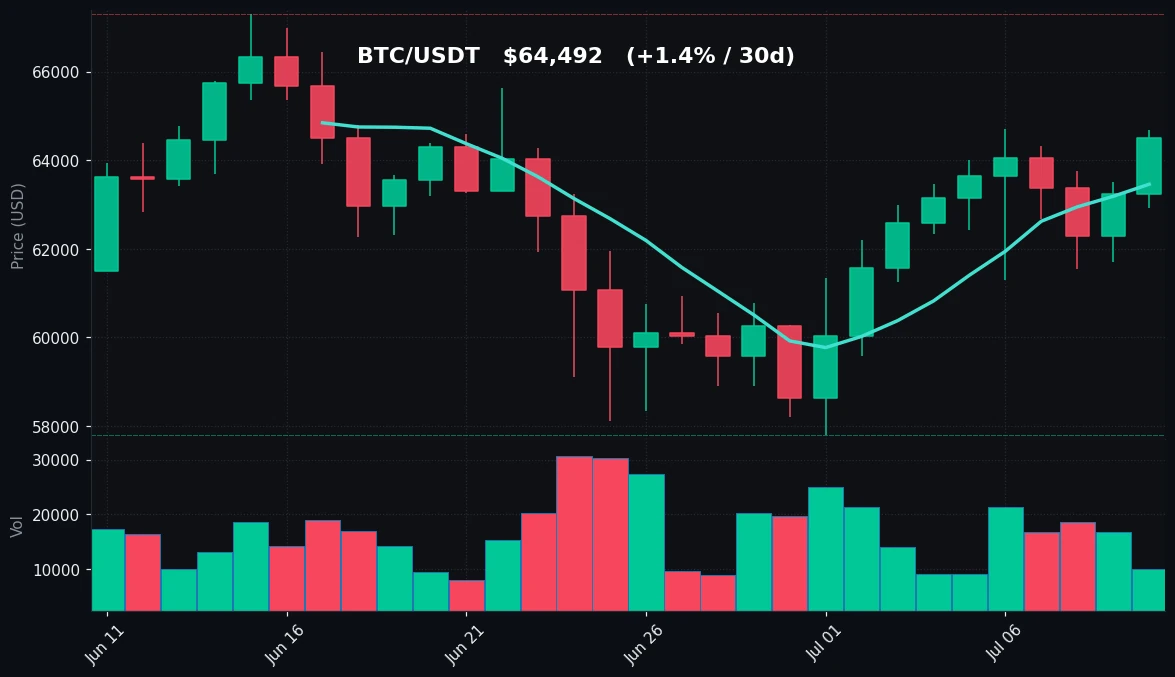
TradingView Live (4h)
Bitcoin’s price action on July 10 reflects a continuation of the recovery from its 30-day low of $57,800, recorded on June 10. The current price of $64,492 is above both the 7-day moving average (MA7) of $63,459 and the 30-day moving average (MA30) of $62,754, confirming a bullish short- and medium-term trend. The 7-day high of $64,700 was nearly tested on the day, with the intraday peak at $64,693, suggesting that resistance near $64,700–$65,000 remains a key barrier. The 30-day high of $67,292, set on June 17, is still 4.2% above current levels, providing a potential upside target if momentum continues.
Volume, however, tells a more cautious story. BTC’s trading volume on July 10 is only 0.66 times the 7-day average, indicating that the price increase is not backed by strong market participation. This divergence between rising price and falling volume can signal weakening conviction, potentially leading to a pullback or consolidation. The RSI of 68.0 is approaching the overbought threshold of 70, which historically has preceded short-term corrections or sideways moves. If the RSI crosses above 70, it may indicate an overextended rally, especially given the volume deficit.
From a technical perspective, the key support level to watch is the MA7 at $63,459, which has acted as dynamic support during the recent uptrend. A break below this level could expose the MA30 at $62,754 and then the psychological $62,000 zone. On the upside, a decisive move above $64,700 would challenge the 30-day high of $67,292. The lack of volume suggests that any breakout may require a catalyst—such as macroeconomic news or institutional flows—to sustain a move higher. Overall, Bitcoin’s structure remains bullish in the short term, but the declining volume and near-overbought RSI warrant caution for aggressive positioning.
Ethereum Analysis
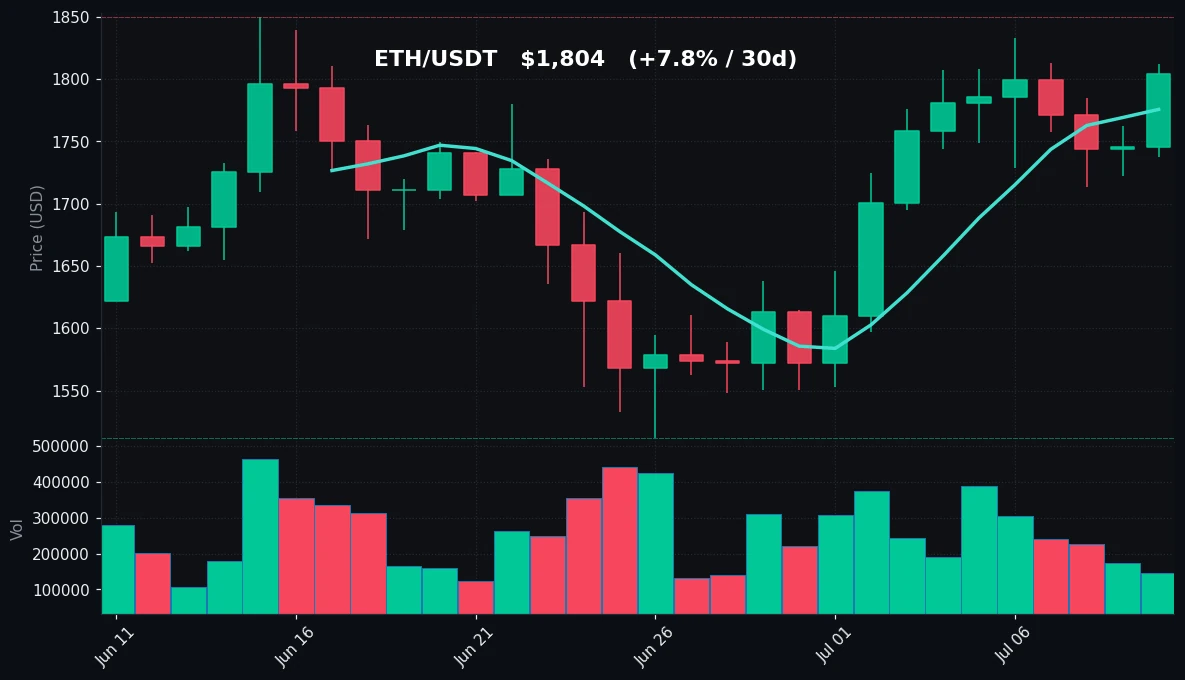
TradingView Live (4h)
Ethereum’s performance on July 10 is notably stronger than Bitcoin’s, with a 3.36% daily gain and a 7.79% rise over the past 30 days. The current price of $1,804 sits above both the MA7 of $1,776 and the MA30 of $1,698, confirming a bullish alignment. The 7-day high of $1,833 was not reached on the day (intraday high $1,812), but the price remains within striking distance. The 30-day high of $1,850, set on June 17, is only 2.5% away, suggesting that Ethereum has room to test resistance near $1,850–$1,870 if momentum persists.
However, Ethereum’s RSI of 76.0 is firmly in overbought territory (above 70), signaling that the asset may be due for a short-term correction or consolidation. Overbought RSI readings do not always lead to immediate reversals—especially in strong trends—but they do increase the probability of a pullback. Volume is also weak, at 0.57 times the 7-day average, similar to Bitcoin’s pattern. This combination of overbought RSI and declining volume suggests that the recent rally may be losing steam, and buyers may be hesitant to chase prices higher.
Key support levels for Ethereum include the MA7 at $1,776, which has provided dynamic support during the uptrend. Below that, the MA30 at $1,698 and the psychological $1,700 zone offer stronger support. The 30-day low of $1,512, recorded on June 10, represents a major support level in the event of a deeper correction. On the upside, resistance at $1,833 (7-day high) and $1,850 (30-day high) are the immediate hurdles. A break above $1,850 would open the path toward $1,900, which has not been tested since late May. Ethereum’s relative strength compared to Bitcoin may attract capital rotation, but the overbought condition and low volume argue for a cautious approach.
Key Technical Levels
| Asset | Support (MA7) | Resistance (30d High) | RSI Status |
|---|---|---|---|
| BTC | $63,459 | $67,292 | Neutral (68.0, approaching overbought) |
| ETH | $1,776 | $1,850 | Overbought (76.0) |
BTC vs ETH Dynamic
The correlation between Bitcoin and Ethereum remains high in the current market environment, with both assets rising in tandem over the past 24 hours and 7 days. However, Ethereum is outperforming Bitcoin on both a daily and monthly basis, with a 30-day gain of +7.79% versus BTC’s +1.36%. This divergence suggests that capital may be rotating into Ethereum, possibly driven by expectations of network upgrades, DeFi activity, or relative value plays. The ETH/BTC ratio, which is not explicitly provided but can be inferred, is likely rising. Despite this, both assets share similar volume weakness and RSI concerns, indicating that the broader market lacks strong conviction. If a correction occurs, Ethereum’s higher RSI may make it more vulnerable to a sharper pullback than Bitcoin.
Strategy Fit
Given the current market conditions—rising prices with declining volume and near-overbought RSI levels—a neutral-to-cautious strategy is appropriate. For traders using Pionex’s built-in bots, the Grid Trading Bot is well-suited for this environment. A narrow grid range around current prices (e.g., BTC $62,000–$66,000; ETH $1,700–$1,850) can capture profits from potential consolidation or small pullbacks without requiring directional conviction. The DCA Bot could also be considered for long-term accumulation, but the overbought RSI suggests that adding positions at current levels carries higher short-term risk. For trend-following strategies, the Rebalancing Bot may help maintain exposure to both assets while managing risk, but traders should set tight stop-losses or reduce position sizes given the volume divergence. Avoid aggressive leverage or breakout trades until volume confirms the next move.
Risk Disclaimer
This market recap is for informational and educational purposes only and does not constitute financial advice, investment recommendation, or solicitation to buy or sell any asset. Cryptocurrency markets are highly volatile and involve substantial risk, including the potential loss of principal. Past performance is not indicative of future results. Technical indicators and levels are based on historical data and may not accurately predict future price movements. Always conduct your own research and consult with a licensed financial advisor before making any investment decisions. The author and Pionex are not responsible for any trading losses incurred.
FAQ
Q: What is driving Bitcoin’s price increase despite low volume?
A: The price increase may be driven by a small group of buyers or institutional orders, but the low volume relative to the 7-day average suggests that broader market participation is weak. This can lead to a fragile rally that may reverse quickly if selling pressure increases.
Q: Why is Ethereum’s RSI overbought while Bitcoin’s is not?
A: Ethereum has rallied more sharply over the past 30 days (+7.79% vs. BTC’s +1.36%), causing its RSI to reach 76.0, above the 70 overbought threshold. Bitcoin’s more modest gains have kept its RSI at 68.0, still below overbought. Overbought RSI does not guarantee a correction but increases the probability.
Q: What are the key support levels for BTC and ETH today?
A: For BTC, the immediate support is the 7-day moving average at $63,459, followed by the 30-day moving average at $62,754. For ETH, support is at the 7-day MA of $1,776, then the 30-day MA of $1,698. A break below these levels could signal a trend reversal.
Q: How does the volume decline affect trading strategies?
A: Low volume during a price increase suggests a lack of conviction. Grid trading or DCA strategies are preferable to trend-following or breakout trades, as the latter may suffer from false signals. Traders should also consider reducing position sizes and setting tighter stop-losses.
Q: Should I buy ETH now given its overbought RSI?
A: Overbought RSI alone is not a sell signal, but it does indicate that the asset has risen quickly and may be due for a correction. If you are a long-term investor, DCA could average out entry prices. For short-term traders, waiting for a pullback to support levels (e.g., $1,776 or $1,698) may offer better risk-reward. Always assess your own risk tolerance and portfolio.


