BTC ETH Daily Recap — 2026-10-07

BTC ETH Daily Recap — 2026-10-07
Today at a Glance
Bitcoin changed hands at $83,094, down 2.87% over the past 24 hours after trading between $82,787 and $85,598. The move extends a softer seven-day stretch to -0.63%, though the 30-day window remains positive at +5.91%. BTC is now sitting below its 7-day moving average of $85,013 but still above its 30-day average of $81,832, with RSI(14) at 42.7 — a neutral-to-soft reading. Volume came in at 1.03x the 7-day average, suggesting no dramatic capitulation.
Ethereum fared worse, sliding 4.89% to $2,566 and printing a 7-day loss of -4.48% against a +3.24% 30-day gain. ETH's RSI(14) has dropped to 31.2, edging toward oversold territory, while volume ran 1.34x the 7-day average — heavier relative activity than BTC. ETH also closed below both its 7-day ($2,680) and 30-day ($2,612) moving averages, a clear short-term shift in momentum.
Bitcoin Analysis
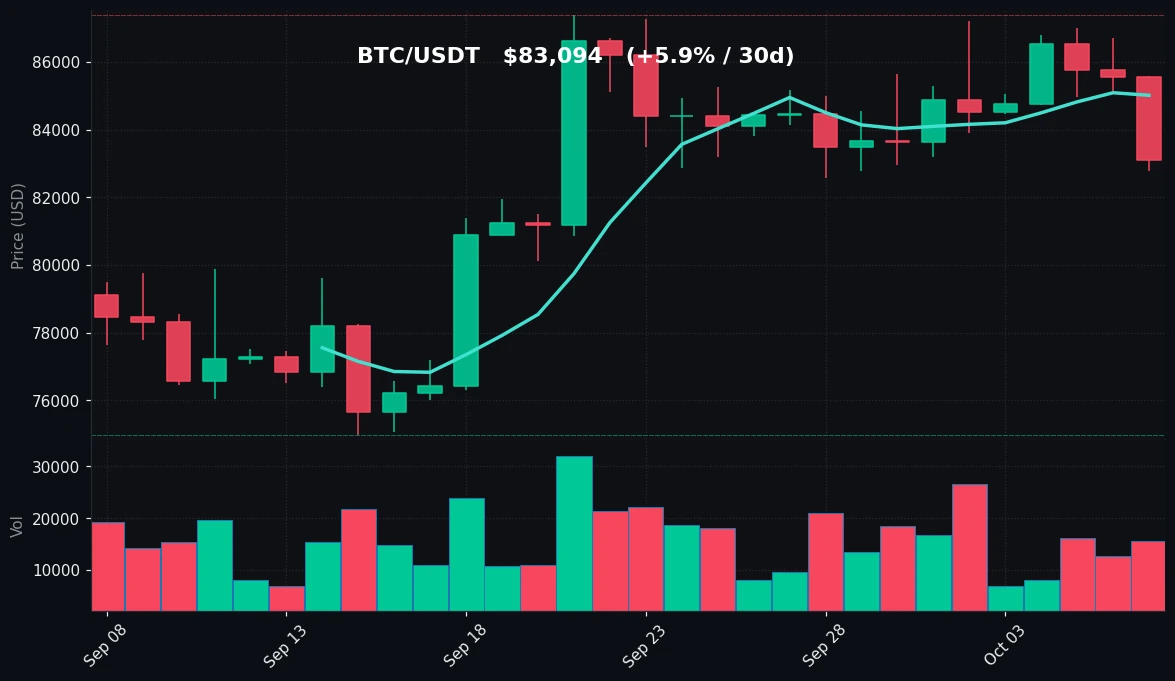
TradingView Live (4h)
Bitcoin's daily structure has shifted from consolidation to mild distribution over the past 24 hours. The session opened near the upper end of the recent range and sold off through the day, tagging a low of $82,787 before stabilizing around $83,094. That low is notable because it coincides with the bottom of the 7-day range, meaning BTC has now tested and held the lower boundary of its recent channel. The 24-hour high of $85,598 failed to reclaim the 7-day high of $87,220, confirming that upside momentum has faded relative to earlier in the week.
On the moving-average front, the picture is mixed but tilting cautious. The 7-day MA at $85,013 sits above spot, so short-term traders are working with a bearish cross — price below the fast average. However, the 30-day MA at $81,832 remains comfortably below spot, keeping the intermediate trend intact. This configuration — price between the two averages — typically signals a pullback within a broader uptrend rather than a trend reversal, though the burden of proof now sits with buyers to reclaim the 7-day line.
Volume at 1.03x the 7-day average is essentially neutral. There is no evidence of panic selling, nor of aggressive accumulation. In a -2.87% session, flat volume suggests orderly profit-taking rather than a stampede for the exits. That is a constructive detail for anyone watching market microstructure.
RSI(14) at 42.7 is neutral, leaning soft. It is not oversold, and it is not overbought. The reading leaves room for further downside without triggering mechanical mean-reversion signals, but it also means BTC is not extended in either direction. The 30-day range — $74,968 to $87,396 — frames the wider context: BTC is roughly mid-range on a monthly basis, having recovered from the late-September lows but failing to sustain the push toward the $87,000+ zone.
Key levels to monitor: on the downside, $82,787 is the immediate 7-day low and the first line of defense; below that, the 30-day MA at $81,832 becomes the structural pivot. On the upside, $85,013 (7-day MA) is the first hurdle, followed by $87,220 (7-day high) and $87,396 (30-day high). A sustained close below the 30-day MA would materially weaken the intermediate trend; a reclaim of the 7-day MA would neutralize the current softness.
Ethereum Analysis
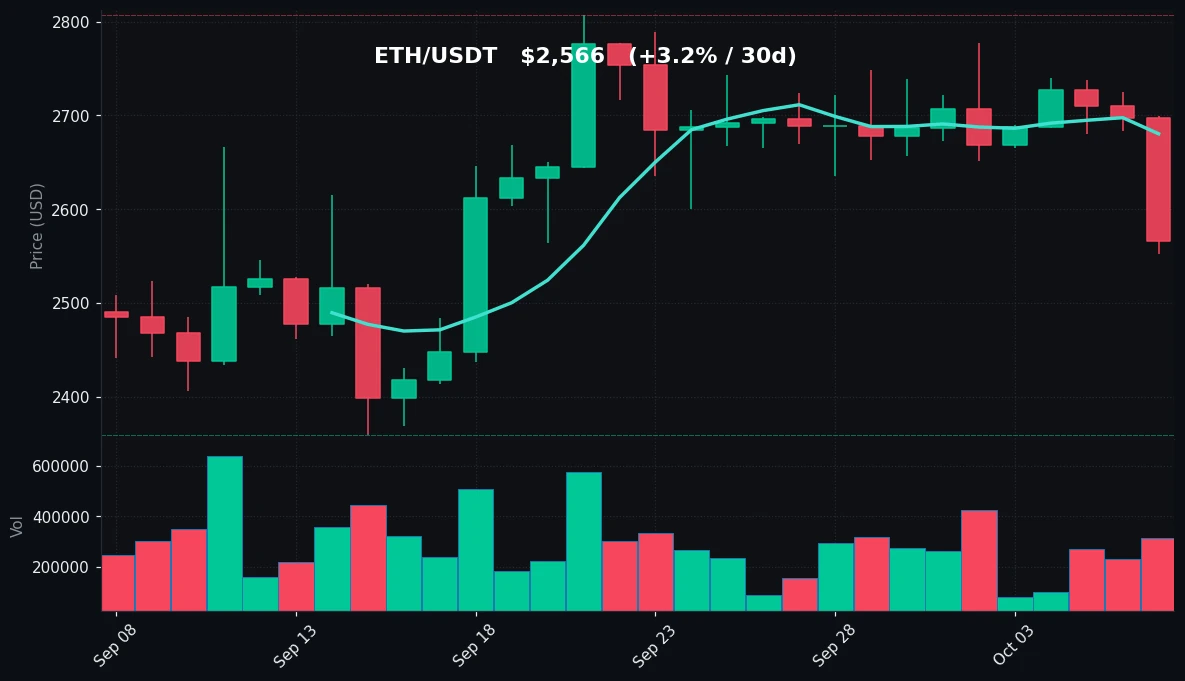
TradingView Live (4h)
Ethereum's session was decisively weaker than Bitcoin's. ETH fell 4.89% to $2,566, underperforming BTC's -2.87% by a wide margin. The daily range — $2,552 to $2,700 — shows ETH closed near the lows, a sign that sellers maintained control into the close. The 7-day performance of -4.48% versus BTC's -0.63% underscores a clear relative-weakness dynamic that has developed over the past week.
The moving-average structure is more concerning than BTC's. ETH trades below both its 7-day MA ($2,680) and its 30-day MA ($2,612). That is a bearish alignment — price beneath both fast and slow averages — and it contrasts with BTC, which still holds above its 30-day line. ETH's failure to hold the 30-day average is a meaningful technical development, as that level had acted as support through much of the recent advance from the 30-day low of $2,359.
Volume at 1.34x the 7-day average is elevated, and combined with the sharp decline, it points to genuine distribution rather than thin, noise-driven selling. Higher volume on a down day is a classic sign of supply hitting the market. The 30-day high of $2,807 now looks distant, and ETH has given back a substantial portion of its monthly gain, which has shrunk to +3.24%.
RSI(14) at 31.2 is the most striking data point. It is approaching — but has not yet reached — the conventional 30 threshold for oversold conditions. In trending markets, RSI can push below 30 and stay there, so this reading should be treated as a warning of stretched downside momentum rather than an automatic buy signal. Still, at 31.2, ETH is closer to oversold than at any point in the recent data set.
Key levels: immediate support rests at the 24-hour and 7-day low of $2,552. A break below that opens the door toward the 30-day low of $2,359. On the upside, ETH must first reclaim the 30-day MA at $2,612, then the 7-day MA at $2,680, with the 7-day high of $2,777 and 30-day high of $2,807 as the larger targets. Until ETH reclaims at least the 30-day average, the short-term bias remains corrective.
Key Technical Levels
| Asset | Support | Resistance | RSI |
|---|---|---|---|
| BTC | $82,787 (7d low) / $81,832 (MA30) | $85,013 (MA7) / $87,220 (7d high) | 42.7 — neutral |
| ETH | $2,552 (7d low) / $2,359 (30d low) | $2,612 (MA30) / $2,680 (MA7) | 31.2 — near oversold |
BTC vs ETH Dynamic
The two majors remain positively correlated — they are, after all, the two dominant beta expressions of the same crypto market — but the correlation is currently asymmetric in magnitude. Both fell today, both sit below their 7-day moving averages, and both have given back part of their 30-day gains. The divergence lies in degree: ETH's -4.89% versus BTC's -2.87%, ETH's break below its 30-day MA versus BTC's hold above it, and ETH's RSI at 31.2 versus BTC's 42.7. This pattern — BTC outperforming ETH on the downside — is a classic risk-off rotation within crypto, where capital consolidates into the largest, most liquid asset first. When ETH leads to the downside, it typically signals that traders are reducing exposure to higher-beta names rather than exiting the asset class entirely. A stabilization in ETH relative to BTC would be an early tell that the broader pullback is maturing; continued ETH underperformance would suggest the risk-reduction phase is still underway.
Strategy Fit
Today's conditions — elevated ETH volatility, neutral-to-soft BTC momentum, and prices oscillating within well-defined ranges — are the kind of environment where strategy selection matters more than directional conviction. For range-bound behavior between established support and resistance, grid strategies are structurally suited: they monetize oscillation without requiring a view on direction, and the defined boundaries (BTC $82,787–$87,220; ETH $2,552–$2,777) provide natural grid parameters. For participants with a longer horizon, dollar-cost averaging fits a market that is mid-range on the monthly frame and not extended in either direction, smoothing entries through the current chop. Trend-following approaches are less favored today, since both assets sit below their 7-day averages and momentum is corrective rather than directional — trend systems tend to underperform in choppy, mean-reverting tape.
Platforms such as Pionex offer built-in bots designed for exactly these regimes, including grid trading bots that automate buy-low/sell-high execution within a chosen range, DCA bots that schedule recurring entries, and trend-oriented bots for when momentum reasserts itself. Matching the tool to the regime — grid or DCA in choppy conditions, trend bots when a clear directional break occurs — is a more disciplined approach than forcing a single strategy into every market. The key is defining invalidation levels in advance: for grids, a decisive break outside the range; for DCA, a thesis-level change in the broader trend.
Risk Disclaimer
This material is provided for informational and educational purposes only and does not constitute financial, investment, or trading advice. It is not a recommendation to buy, sell, or hold any asset. Cryptocurrency markets are highly volatile and can result in the total loss of capital. Technical indicators, moving averages, RSI readings, and support/resistance levels described above are historical observations, not predictions of future price behavior. Past performance is not indicative of future results. You should conduct your own research and consult a qualified financial professional before making any investment decision. You are solely responsible for your own trading activity and risk management.
FAQ
What happened to Bitcoin on 2026-10-07?
BTC traded at $83,094, down 2.87% over 24 hours, with a session range of $82,787 to $85,598. It remains above its 30-day moving average of $81,832 but below its 7-day average of $85,013.
Why did Ethereum fall more than Bitcoin?
ETH dropped 4.89% to $2,566 versus BTC's -2.87%. ETH also broke below both its 7-day ($2,680) and 30-day ($2,612) moving averages, and its RSI fell to 31.2, indicating heavier relative selling pressure and a risk-off rotation toward BTC.
What does ETH's RSI of 31.2 mean?
RSI(14) at 31.2 is approaching the conventional oversold threshold of 30. It signals stretched downside momentum, but it is not an automatic buy signal — in strong downtrends, RSI can remain low or push below 30 for extended periods.
What are the key levels to watch?
For BTC: support at $82,787 and $81,832, resistance at $85,013 and $87,220. For ETH: support at $2,552 and $2,359, resistance at $2,612 and $2,680. These levels frame the current range boundaries.
Which trading strategies suit this market?
With both assets range-bound and ETH volatility elevated, grid and DCA strategies are commonly used to navigate choppy conditions, while trend-following is less favored given the corrective short-term momentum. Pionex offers built-in bots for grid, DCA, and trend approaches. This is not financial advice.


