BTC ETH Daily Recap — 2026-10-23

BTC ETH Daily Recap — 2026-10-23
Today at a Glance
Both major cryptocurrencies posted modest gains over the past 24 hours, though the broader picture remains one of consolidation rather than breakout. Bitcoin traded at $81,994, up 0.71% on the day, having ranged between $81,118 and $82,061. Ether outperformed on the daily timeframe at $2,415, up 1.10%, with a tight intraday band of $2,381–$2,418. Despite the green candles, both assets remain below their short- and medium-term moving averages, and volume is notably thin — BTC volume sits at just 0.53x its 7-day average, ETH at 0.51x. Over the trailing 30 days, BTC is down 2.86% and ETH down 10.14%, reflecting a persistent grind lower from September highs. RSI readings of 47.6 for BTC and 42.9 for ETH place both firmly in neutral territory, with ETH leaning slightly weaker. Today's action is best characterized as low-conviction drift within established ranges.
Bitcoin Analysis
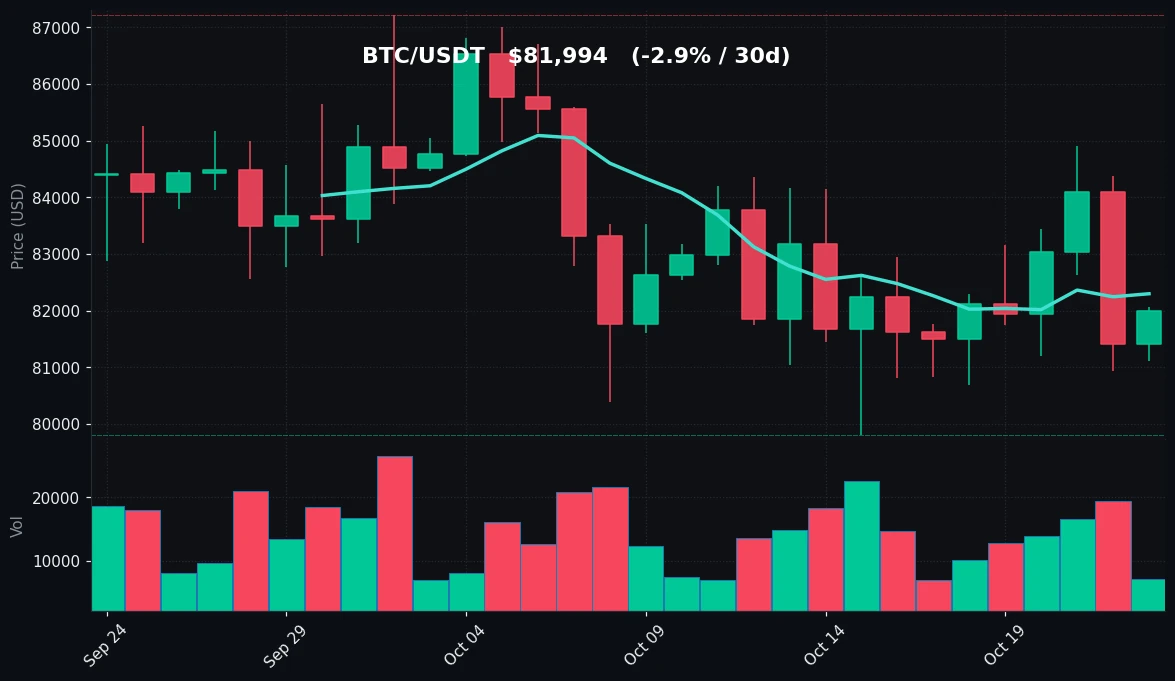
TradingView Live (4h)
Bitcoin's price structure remains range-bound and mildly defensive. At $81,994, BTC is trading roughly 0.4% below its 7-day moving average of $82,297 and about 1.7% below its 30-day moving average of $83,377. The ordering of these averages — price below MA7 below MA30 — is a classic short-term bearish alignment, indicating that recent momentum has not been sufficient to reclaim even the shortest trend measure. The 30-day range spans from a low of $79,800 to a high of $87,220, a band of roughly 9.3%, and price currently sits in the lower-middle portion of that envelope, about 2.7% above the 30-day floor and 6.0% below the ceiling.
On the 7-day horizon, BTC's high of $84,898 and low of $80,684 frame a tighter consolidation zone. The current price is positioned near the lower third of this weekly band. The immediate technical reference points are clear: the $82,297 MA7 acts as first-line resistance overhead, with the $83,377 MA30 forming a second, more meaningful cap. To the downside, the $80,684 weekly low is the first support shelf, with the $79,800 monthly low representing the more significant structural floor. A sustained hold above the MA7 would be the first sign of short-term stabilization; failure to defend the weekly low would extend the lower-highs sequence visible since the September peak.
Momentum is neutral by RSI(14) at 47.6 — neither oversold nor overbought, and notably not showing any bullish divergence signal at present. The most telling data point is volume: at 0.53x the 7-day average, participation is roughly half of recent norms. Low-volume drift within a range typically reflects indecision rather than accumulation or distribution, and it raises the risk of sharp, liquidity-driven moves in either direction when volume returns. The 24-hour range of just $943 (high $82,061, low $81,118) — about 1.15% of price — confirms compressed intraday volatility. In sum, BTC is a market in balance, leaning slightly weak on trend but lacking the momentum signature of a directional move.
Ethereum Analysis
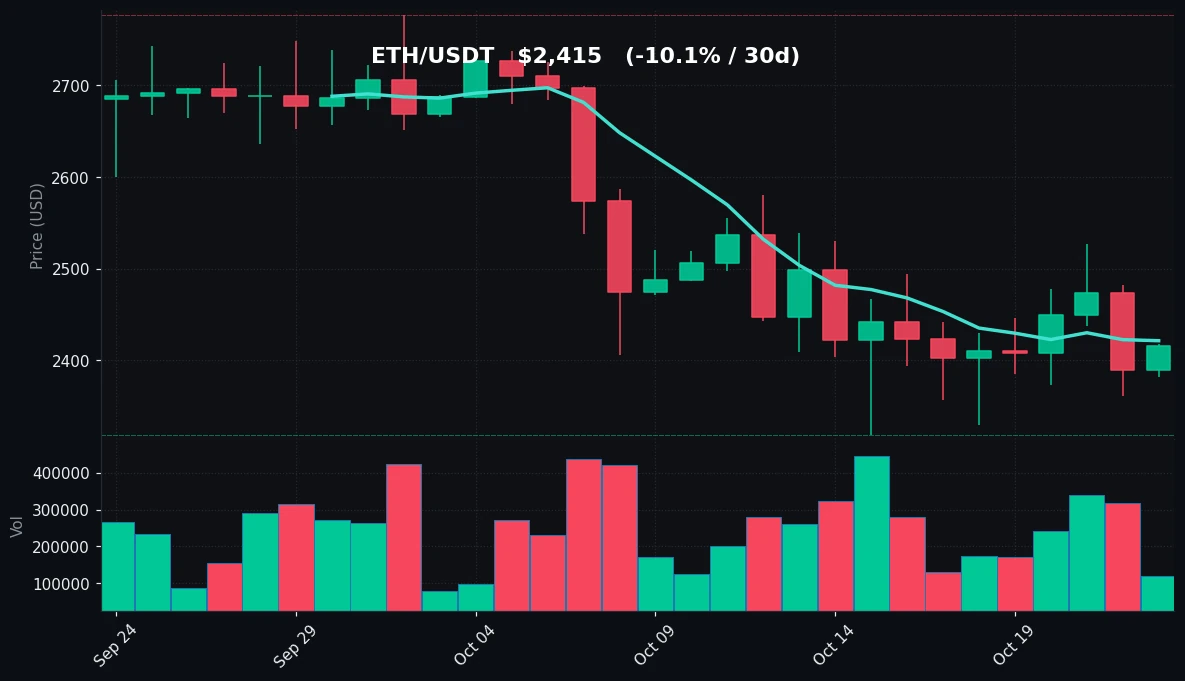
TradingView Live (4h)
Ether's technical posture is weaker than Bitcoin's on nearly every relative measure. At $2,415, ETH trades marginally below its 7-day moving average of $2,421 and a substantial 5.6% below its 30-day moving average of $2,559. The gap between price and the MA30 is the widest structural divergence on the board and reflects the persistent downtrend that has defined the past month. The 30-day range runs from $2,318 to $2,777 — a 19.8% envelope, more than double BTC's percentage range — and price sits just 4.2% above the monthly low while remaining 13.0% below the monthly high. That positioning near the bottom of the range, combined with the pronounced MA30 discount, paints a picture of an asset still searching for a base.
The 7-day band of $2,329 to $2,527 is wider than BTC's on a percentage basis (8.5% versus 5.2%), and the current price sits in the lower half of it. Key levels are well defined: the $2,421 MA7 is an immediate pivot, and a reclaim would be the first constructive step; the $2,527 weekly high is the more meaningful resistance should momentum build. Below, the $2,329 weekly low and the $2,318 monthly low form a tight support cluster around the $2,320–$2,330 zone — a break there would mark a fresh 30-day low and confirm continuation of the downtrend.
RSI(14) at 42.9 is in neutral territory but tilted toward the weaker end of the scale, consistent with the price sitting below both moving averages. Unlike BTC, ETH's RSI has more room to fall before reaching oversold conditions, meaning the current reading does not yet constitute a mean-reversion signal. Volume at 0.51x the 7-day average mirrors BTC's anemic participation — the 24-hour range of just $37 (high $2,418, low $2,381) represents only 1.5% of price, underscoring how thin and compressed the session was. The +1.10% daily gain should be read in context: it follows a 7-day decline of 0.33% and a 30-day decline of 10.14%, making today's move a modest bounce within a larger corrective structure rather than a trend reversal.
Key Technical Levels
| Asset | Support | Resistance | RSI |
|---|---|---|---|
| BTC | $80,684 (7d low) / $79,800 (30d low) | $82,297 (MA7) / $83,377 (MA30) / $84,898 (7d high) | 47.6 — neutral |
| ETH | $2,329 (7d low) / $2,318 (30d low) | $2,421 (MA7) / $2,527 (7d high) / $2,559 (MA30) | 42.9 — neutral |
BTC vs ETH Dynamic
The two largest assets remain directionally correlated today — both printed green 24-hour candles (+0.71% BTC, +1.10% ETH) within compressed, low-volume ranges — but their medium-term trajectories have diverged meaningfully. Over 30 days, ETH's 10.14% drawdown is more than triple BTC's 2.86% decline, and ETH's 5.6% discount to its MA30 versus BTC's 1.7% gap shows the altcoin leader absorbing disproportionate selling pressure. ETH's wider 30-day range (19.8% versus BTC's 9.3%) confirms higher beta in both directions, and its lower RSI (42.9 versus 47.6) reflects that relative weakness. The practical implication is that ETH is currently the higher-volatility expression of the same market beta: when BTC stabilizes, ETH may bounce harder in percentage terms, but when BTC rolls over, ETH's thinner support structure near $2,320 makes it more vulnerable to a breakdown. Correlation remains high on the daily timeframe, but relative strength favors BTC.
Strategy Fit
Today's conditions — compressed intraday ranges, volume at roughly half of the 7-day average, neutral RSI on both assets, and price oscillating within well-defined support/resistance bands — are characteristic of a range-bound, low-conviction market. In such environments, trend-following approaches face whipsaw risk because neither asset has reclaimed its short-term moving average with conviction, while breakout strategies lack the volume confirmation needed to validate a move. Range-oriented approaches fit the current tape more naturally: grid strategies, which profit from oscillation between defined levels, align with BTC's $80,684–$84,898 weekly band and ETH's $2,329–$2,527 band, provided positions are sized conservatively given the risk of a range break. For longer-horizon participants, the neutral RSI readings and proximity to range lows make systematic DCA a reasonable framework for accumulating exposure without timing risk, particularly for ETH given its deeper 30-day drawdown. Pionex offers built-in bots — including grid trading bots and DCA bots — that let users automate these range-bound and accumulation approaches directly on the exchange, with parameters adjustable to the technical levels outlined above. Whatever the approach, position sizing should account for the thin liquidity: low-volume ranges can resolve violently, and stops placed just beyond the identified support levels are prudent.
Risk Disclaimer
This market recap is provided for informational and educational purposes only. It does not constitute financial advice, investment advice, trading advice, or any other form of recommendation, and it should not be relied upon as such. The analysis is based on historical price data and technical indicators as of 2026-10-23; past performance and current technical readings are not indicative of future results. Cryptocurrency markets are highly volatile and can result in the total loss of capital. Nothing in this document is a prediction of future prices. Readers should conduct their own research, consider their personal financial circumstances and risk tolerance, and consult a qualified financial professional before making any investment or trading decision. The author and publisher accept no liability for any losses arising from the use of this information.
FAQ
Q1: What were BTC and ETH's prices on 2026-10-23?
BTC traded at $81,994 (+0.71% over 24 hours) and ETH at $2,415 (+1.10% over 24 hours), according to the data snapshot for the session.
Q2: Are BTC and ETH overbought or oversold right now?
Neither. BTC's RSI(14) is 47.6 and ETH's is 42.9 — both within neutral territory, though ETH's reading is closer to the weaker end of the scale.
Q3: What are the key support and resistance levels to watch?
For BTC, support sits at $80,684 (7-day low) and $79,800 (30-day low), with resistance at $82,297 (MA7), $83,377 (MA30), and $84,898 (7-day high). For ETH, support is at $2,329 (7-day low) and $2,318 (30-day low), with resistance at $2,421 (MA7), $2,527 (7-day high), and $2,559 (MA30).
Q4: Why is trading volume so low today?
BTC volume is at 0.53x its 7-day average and ETH at 0.51x, meaning participation is roughly half of recent norms. Low volume alongside compressed intraday ranges typically signals market indecision, though it can also precede sharp moves when liquidity returns.
Q5: Which trading strategy fits the current market conditions?
With both assets range-bound, volume thin, and RSI neutral, range-oriented strategies such as grid trading and systematic DCA tend to align better with current conditions than trend-following. Pionex's built-in grid and DCA bots support automated execution of these approaches. This is not a recommendation — all strategies carry risk, and this is not financial advice.


