BTC ETH Daily Recap — 2026-10-18

BTC ETH Daily Recap — 2026-10-18
Today at a Glance
Bitcoin enters the weekend session effectively flat on the day, trading at $81,473 for a 24-hour change of -0.02%, confined to a narrow intraday band between $81,314 and $82,295. The broader picture is softer: BTC is down 2.75% over seven days but still marginally positive over 30 days at +0.27%, a spread that underscores how much of the recent move has been consolidation rather than directional conviction. Volume tells the more important story — at just 0.35x the seven-day average, participation has thinned dramatically.
Ethereum is the weaker of the two. At $2,395, ETH is down 0.34% on the day, 5.61% on the week, and 9.04% on the month. Its 24-hour range of $2,383–$2,430 was similarly compressed, but the weekly low of $2,318 marks the deepest point of the recent slide. ETH volume is even lighter than BTC's at 0.23x the seven-day average, and its 14-period RSI has fallen to 22.3 — a reading that places it firmly in oversold territory.
Bitcoin Analysis
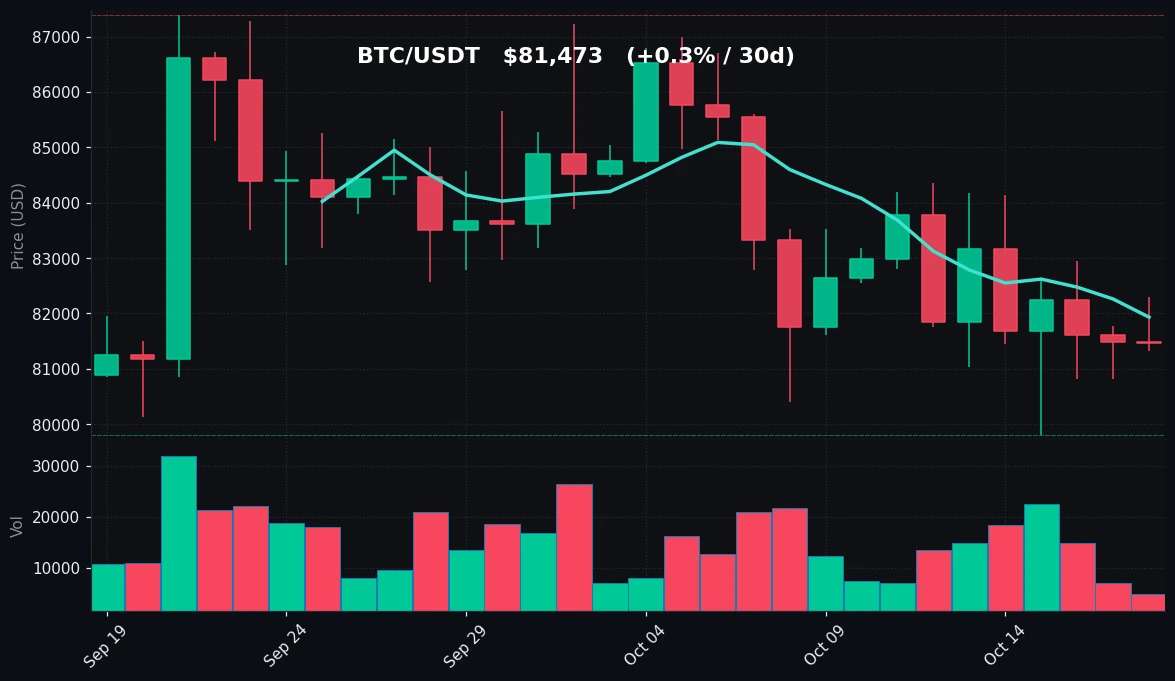
TradingView Live (4h)
Bitcoin's trend structure on the daily timeframe remains corrective but orderly. Price at $81,473 sits below both the 7-period moving average of $81,932 and the 30-period moving average of $83,595, a configuration that confirms the short-term trend is down while the medium-term average continues to slope gently higher. The gap between the two averages — roughly $1,663, or about 2% — is modest by historical standards and suggests a market that has drifted rather than broken.
The key technical levels are clearly defined by recent price action. To the downside, the $79,800 zone is the reference point: it served as both the seven-day low and the 30-day low, making it the single most consequential support in the current structure. A daily close beneath that level would invalidate the consolidation thesis and open the door to a deeper retracement. To the upside, immediate resistance sits at the 7-period MA near $81,932, followed by the 30-period MA at $83,595. Above that, the seven-day high of $84,352 and the 30-day high of $87,396 represent the levels that would need to be reclaimed to restore a constructive trend.
Volume is the most notable feature of the current tape. At 0.35x the seven-day average, participation is roughly a third of what it has been recently. In technical terms, low-volume drift within a range is generally interpreted as a lack of conviction from either side rather than as an accumulation or distribution signal. The 24-hour range of just $981 — about 1.2% of spot price — reinforces that reading.
The 14-period RSI at 30.3 is the most closely watched indicator on the board. It sits just above the conventional 30 threshold that separates neutral from oversold. Notably, price is not making new lows even as momentum has cooled — the 30-day low of $79,800 was set earlier in the period, and the current price is roughly 2% above it. That divergence between price and momentum is a factual observation about the current structure, not a directional signal. What can be said with confidence is that Bitcoin is trading in a well-defined range with compressed volatility, subdued volume, and momentum near a threshold that historically attracts mean-reversion interest.
Ethereum Analysis
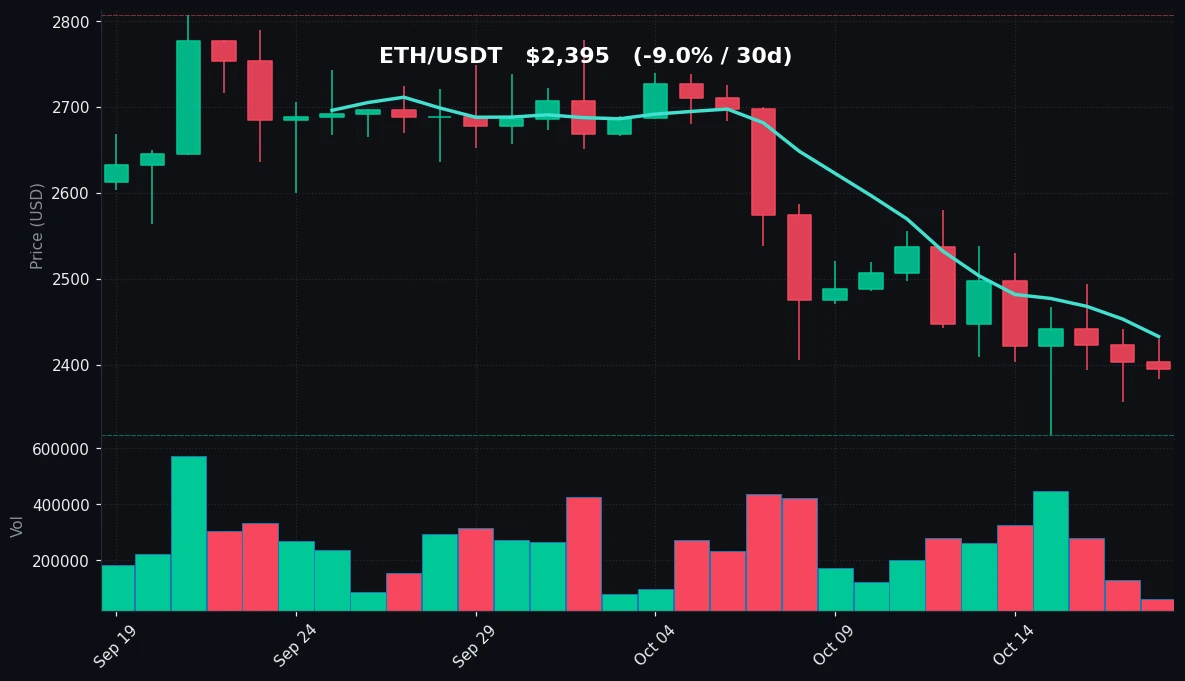
TradingView Live (4h)
Ethereum's technical picture is materially weaker than Bitcoin's across every metric in the dataset. At $2,395, ETH trades below its 7-period MA of $2,433 and well below its 30-period MA of $2,604 — a spread of roughly $209, or 8.7%, between spot and the medium-term average. That is a considerably wider dislocation than BTC's, and it reflects a month-long decline of 9.04% that has left ETH trading near the lower end of its 30-day range.
The support and resistance map is unambiguous. The $2,318 level is the critical floor: it is both the seven-day low and the 30-day low, meaning ETH has already tested it and held. A decisive break below would mark a fresh monthly low. On the topside, the first hurdle is the 7-period MA at $2,433, then the seven-day high of $2,580, with the 30-day high of $2,807 standing as the level that would be required to reverse the monthly downtrend. The 24-hour range of $2,383–$2,430 was tight — about 2% of spot — but it occurred in the bottom portion of the weekly range, which is a positional detail worth noting.
Volume is strikingly thin. At 0.23x the seven-day average, ETH is trading on less than a quarter of its recent typical volume, even lighter than Bitcoin on a relative basis. In a declining market, low volume can indicate that selling pressure has exhausted itself, but it equally indicates an absence of buyers. The data does not resolve which interpretation is correct; it only establishes that conviction is low.
The RSI(14) at 22.3 is the standout figure. That is a deeply oversold reading — well below the 30 threshold and lower than BTC's 30.3 by a wide margin. ETH has underperformed BTC by roughly 2.9 percentage points over seven days (-5.61% vs -2.75%) and by roughly 9.3 points over 30 days (-9.04% vs +0.27%). That performance gap, combined with the more extreme momentum reading and the proximity to the $2,318 floor, defines the current Ethereum setup: oversold, underperforming, and trading on minimal volume near a well-tested support.
Key Technical Levels
| Asset | Support | Resistance | RSI |
|---|---|---|---|
| BTC | $79,800 | $81,932 / $83,595 | 30.3 — neutral, near oversold threshold |
| ETH | $2,318 | $2,433 / $2,604 | 22.3 — oversold |
BTC vs ETH Dynamic
The correlation between the two assets remains high in direction but has widened in magnitude. Both are trading below their 7- and 30-period moving averages, both posted negative seven-day returns, and both are operating on severely depleted volume — BTC at 0.35x and ETH at 0.23x their respective seven-day averages. Where they diverge is in scale: ETH's seven-day decline of 5.61% is roughly double BTC's 2.75%, and its 30-day return of -9.04% contrasts sharply with BTC's marginally positive +0.27%. The RSI spread — 22.3 versus 30.3 — is the widest it has been in the current dataset, confirming that ETH is bearing the brunt of the risk-off tone. In practice, this means BTC is functioning as the relative safe haven within the pair, while ETH exhibits higher beta to the downside. Traders watching the pair should note that ETH's proximity to its $2,318 floor makes it the more sensitive instrument to any shift in broader sentiment, in either direction.
Strategy Fit
The current market regime — compressed ranges, sub-average volume, and momentum at or near oversold — is structurally suited to range-bound and accumulation-oriented approaches rather than trend-following. Bitcoin's 24-hour range of roughly 1.2% and Ethereum's of roughly 2% are narrow enough that grid strategies, which profit from oscillation within a defined band, have a coherent technical basis: the $79,800–$84,352 zone for BTC and the $2,318–$2,580 zone for ETH provide natural boundaries. Dollar-cost averaging is similarly well-matched to the present conditions, particularly for ETH given its oversold RSI and proximity to a tested support level — though the absence of volume means entries should be sized conservatively. Trend-following strategies are the poorest fit today: with both assets below their key moving averages and no volume confirmation in either direction, breakout signals carry elevated false-positive risk. Pionex offers built-in bots that map directly onto these regimes — grid trading bots for range conditions, DCA bots for staggered accumulation, and futures grid bots for more advanced users — allowing the strategy to be matched to the technical setup rather than to sentiment. Position sizing and stop placement should reflect the thin liquidity implied by the volume data.
Risk Disclaimer
This article is provided for informational purposes only and does not constitute financial advice, investment advice, or a recommendation to buy or sell any asset. Cryptocurrency markets are highly volatile and can result in the total loss of capital. The technical levels and indicators discussed are historical observations, not predictions of future price movement. Past performance is not indicative of future results. Readers should conduct their own research and consult a qualified financial professional before making any investment decision.
FAQ
What was Bitcoin's price on 2026-10-18?
Bitcoin traded at $81,473, down 0.02% over 24 hours, within a range of $81,314 to $82,295.
Why is Ethereum's RSI significant right now?
ETH's RSI(14) stands at 22.3, which is below the conventional 30 threshold and indicates oversold conditions on the daily timeframe. It is notably lower than BTC's 30.3.
What are the key support levels for BTC and ETH?
BTC's critical support is $79,800, which is both its seven-day and 30-day low. ETH's critical support is $2,318, also its seven-day and 30-day low.
What does the low trading volume indicate?
BTC volume is at 0.35x its seven-day average and ETH at 0.23x. This indicates reduced market participation and low conviction from both buyers and sellers, rather than a directional signal.
Which trading strategies suit the current market conditions?
Range-bound conditions with compressed volatility favor grid strategies and dollar-cost averaging. Pionex's built-in grid and DCA bots are designed for exactly these regimes. Trend-following is less well-suited given the absence of volume confirmation.


