BTC ETH Daily Recap — 2026-10-15

BTC ETH Daily Recap — 2026-10-15
Today at a Glance
Bitcoin and Ethereum both closed the session in negative territory, with ETH underperforming its larger peer by a wide margin. BTC/USDT changed hands at $80,210, down 1.80% over 24 hours, after trading between $79,800 and $81,939. On a weekly basis, BTC is down 1.89%, though it remains up 5.25% over 30 days. ETH/USDT printed $2,341, down 3.32% on the day, with a 24-hour range of $2,318 to $2,429. Ethereum's weekly decline of 5.40% and 30-day decline of 3.18% contrast sharply with BTC's positive monthly reading. Notably, ETH's 24h low, 7d low, and 30d low all sit at the same $2,318 level, indicating that today's session probed the lowest price in at least a month. Volume was modestly elevated for both assets relative to their 7-day averages — 1.08x for BTC and 1.2x for ETH — suggesting the sell-off carried slightly more participation than typical recent sessions, but not climactic levels.
The technical picture diverges meaningfully. BTC's RSI(14) at 34.8 is in bearish-leaning neutral territory, while ETH's RSI(14) at 24.2 is deeply oversold. Both assets trade below their 7-day and 30-day moving averages, confirming near-term downtrend structure. The key story of the day is relative weakness in ETH and the fact that BTC is holding a monthly gain despite the pullback.
Bitcoin Analysis
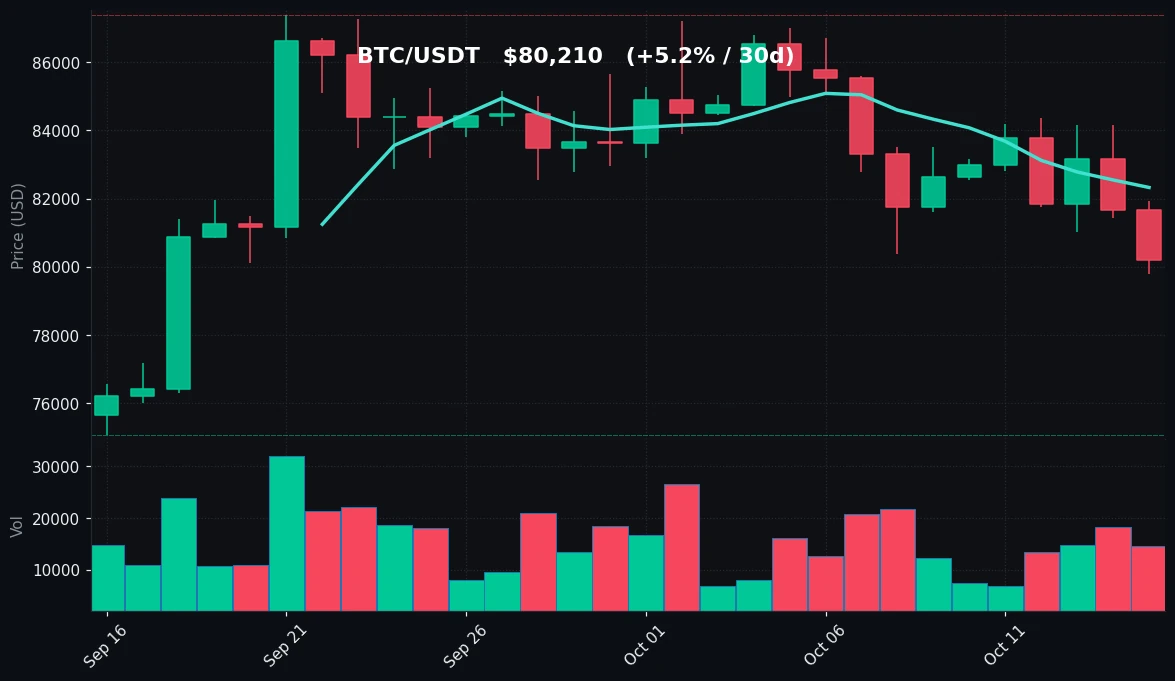
TradingView Live (4h)
Bitcoin's session opened near the upper end of its range and sold off through the day, tagging a low of $79,800 before stabilizing around $80,210. The high of $81,939 was set early, meaning the intraday path was a steady grind lower rather than a sharp flush. That pattern — lower highs and lower lows within the session — is consistent with distribution rather than panic selling.
On the moving averages, BTC is trading below both its MA7 at $82,330 and its MA30 at $83,158. The 7-day average sitting below the 30-day average is a short-term bearish configuration, and price below both reinforces that the near-term trend is down. The gap between spot at $80,210 and the MA30 at $83,158 is roughly 3.7%, which frames the $82,300–$83,200 zone as the immediate overhead supply area where recent buyers are positioned.
Zooming out, the 7-day range runs from $79,800 to $84,352, and the 30-day range from $75,065 to $87,396. That 30-day band is wide — approximately 16.4% from low to high — reflecting the volatility that has characterized the past month. BTC is currently in the lower-middle portion of that 30-day range, closer to the monthly low than the monthly high, but still comfortably above the $75,065 floor. The 30-day gain of 5.25% means that despite the recent 7-day decline of 1.89%, the medium-term trajectory remains positive.
Volume at 1.08x the 7-day average is only marginally above normal. This matters because a breakdown on unremarkable volume suggests an absence of aggressive sellers rather than a wave of capitulation. There is no volume spike that would typically mark a washout low.
RSI(14) at 34.8 places BTC just above the traditional 30 oversold threshold. This is a neutral-to-weak reading: momentum is clearly negative, but the indicator is not yet at levels historically associated with exhausted selling. The combination of price below both MAs, RSI in the mid-30s, and moderate volume describes a market in a controlled decline rather than a crash.
Key levels to monitor on the downside are the $79,800 session/7-day low, which is the first line of defense, followed by the $75,065 monthly low. To the upside, $82,330 (MA7) and $83,158 (MA30) form the first resistance cluster, with $84,352 (7-day high) and $87,396 (30-day high) above that.
Ethereum Analysis
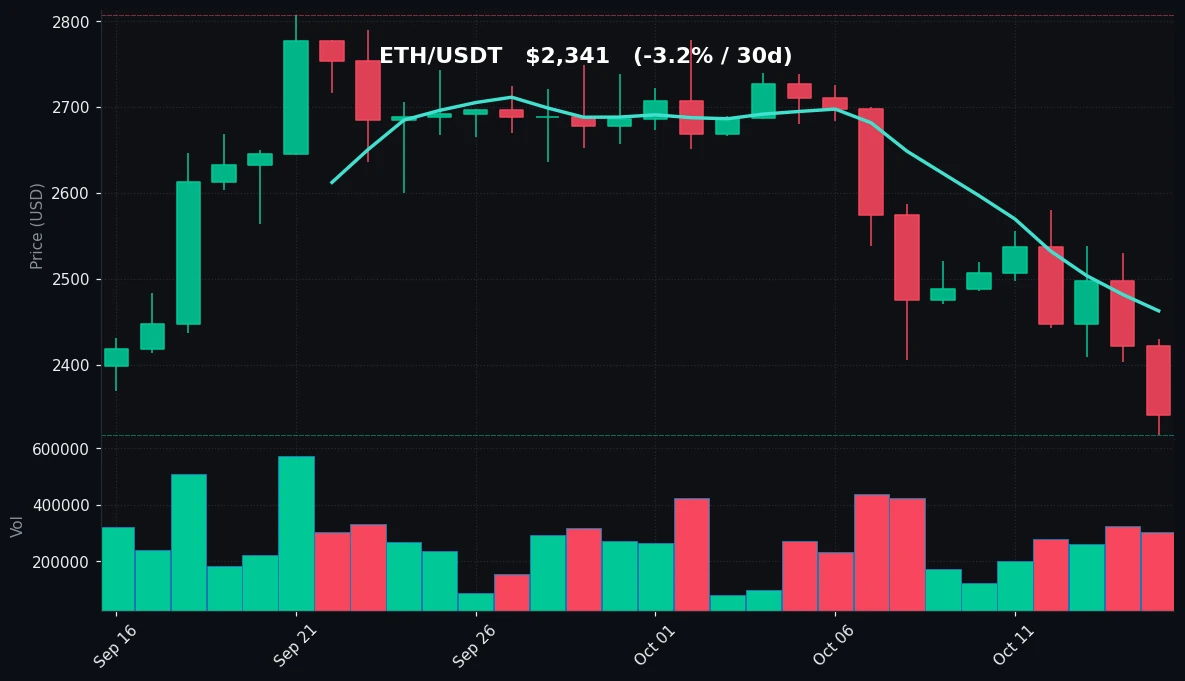
TradingView Live (4h)
Ethereum's session was decisively weaker than Bitcoin's. ETH opened, traded up to a high of $2,429, then sold off to a low of $2,318 — a level that simultaneously represents the 24-hour, 7-day, and 30-day low. Closing at $2,341, ETH gave back 3.32% on the day, roughly 1.8 times BTC's percentage decline.
The moving average structure is more stretched than BTC's. ETH trades below its MA7 at $2,463 and its MA30 at $2,609. The distance from spot to the MA30 is approximately 11.4%, a substantial gap that indicates how far price has traveled from its recent average. When price sits this far below the 30-day mean, it typically signals either a strong trending move or an oversold condition — and the RSI reading helps distinguish between the two.
RSI(14) at 24.2 is firmly in oversold territory, below the 30 threshold. This is a meaningfully more extreme reading than BTC's 34.8. It tells us that ETH's recent selling pressure has been persistent and one-directional. The 7-day decline of 5.40% and 30-day decline of 3.18% confirm that ETH has been losing ground on both timeframes, unlike BTC which remains positive over 30 days.
The range structure is telling. ETH's 7-day high is $2,580 and 30-day high is $2,807, while both the 7-day and 30-day lows converge at $2,318 — today's low. That convergence means ETH has not traded this low in a month, and today's session established a fresh monthly low. This is a bearish structural development, though the oversold RSI suggests the move may be extended in the short term.
Volume at 1.2x the 7-day average is higher than BTC's relative volume, meaning the decline occurred on comparatively greater participation. Elevated volume on a down day that makes a new monthly low is a bearish confirmation signal — sellers were active, not absent.
Resistance overhead begins at $2,463 (MA7), then $2,609 (MA30), with $2,580 (7-day high) sitting between them. Support is defined by the $2,318 monthly low; a sustained break below it would open the door to price discovery lower, while holding it would form a potential base. The extreme RSI and the multi-timeframe low convergence are the two most important technical facts for ETH today.
Key Technical Levels
| Asset | Support | Resistance | RSI |
|---|---|---|---|
| BTC | $79,800 / $75,065 | $82,330 / $83,158 | neutral (34.8) |
| ETH | $2,318 | $2,463 / $2,609 | oversold (24.2) |
BTC vs ETH Dynamic
The correlation between BTC and ETH remains positive — both fell today and both trade below their 7-day and 30-day moving averages — but the magnitude divergence is notable. ETH's 3.32% daily drop versus BTC's 1.80% means ETH declined roughly 1.8x as much, and ETH's 5.40% weekly loss versus BTC's 1.89% shows the gap widening over a longer window. The most striking divergence is on the 30-day timeframe: BTC is up 5.25% while ETH is down 3.18%, an 8.4 percentage point spread. This suggests capital is rotating toward BTC relative to ETH, or at minimum that ETH is bearing the brunt of risk-off flows. The RSI spread — 34.8 for BTC versus 24.2 for ETH — reinforces that ETH is the weaker of the two on a momentum basis. Historically, such RSI divergences can precede mean reversion, but the data here simply describes ETH as the higher-beta, weaker leg of the pair today.
Strategy Fit
Today's conditions present two distinct profiles. BTC's moderate decline, mid-30s RSI, and near-average volume describe a controlled pullback — an environment where range-bound strategies such as grid trading can be relevant, since price is oscillating within a defined band ($79,800–$84,352 over 7 days). ETH's deeply oversold RSI, fresh monthly low, and above-average volume describe a more volatile, directional environment where grid strategies carry higher risk of range breaks, while dollar-cost averaging approaches are sometimes considered by those with longer horizons. Trend-following strategies would note that both assets are below their key moving averages, but the extended nature of ETH's move introduces whipsaw risk.
For traders evaluating execution tools, Pionex offers built-in bots including grid trading, DCA, and trend-following configurations that can be aligned with these market conditions. The choice between them depends on individual risk tolerance and time horizon, not on any expectation about future direction. Matching strategy to the observed volatility regime — range for BTC, elevated volatility for ETH — is the practical takeaway.
Risk Disclaimer
This article is for informational purposes only and does not constitute financial, investment, or trading advice. Cryptocurrency markets are highly volatile and carry substantial risk of loss. The data and technical observations presented describe past and current market conditions only and should not be interpreted as predictions of future price movement. Always conduct your own research and consult a qualified professional before making any investment decision.
FAQ
What were BTC and ETH's prices on 2026-10-15?
BTC/USDT closed at $80,210, down 1.80% over 24 hours. ETH/USDT closed at $2,341, down 3.32% over 24 hours.
Which asset performed worse today?
ETH underperformed BTC, falling 3.32% versus BTC's 1.80% decline. ETH's weekly loss of 5.40% also exceeded BTC's 1.89% weekly decline.
What do the RSI readings indicate?
BTC's RSI(14) of 34.8 is neutral-leaning-bearish, just above oversold. ETH's RSI(14) of 24.2 is in oversold territory, indicating more persistent selling pressure.
What are the key support levels?
BTC's nearest support is $79,800 (session/7-day low), with $75,065 as the 30-day low. ETH's support is $2,318, which is simultaneously its 24h, 7d, and 30d low.
Are BTC and ETH still correlated?
Yes, both declined today and both trade below their 7-day and 30-day moving averages, but the magnitude of ETH's decline was significantly larger, showing a temporary divergence in relative strength.


