BTC ETH Daily Recap — 2026-10-17

BTC ETH Daily Recap — 2026-10-17
Today at a Glance
Bitcoin and Ethereum both closed the session in a state of pronounced inertia, with neither asset able to establish directional conviction. BTC/USDT traded at $81,500, down a marginal -0.14% over 24 hours, confined to an exceptionally narrow intraday band of $81,416–$81,770. The seven-day picture is softer at -1.79%, though the 30-day window remains fractionally positive at +0.76%. Ethereum printed $2,424, effectively flat at +0.04% on the day within a $2,418–$2,442 range. ETH's medium-term trend is the weaker of the two: -3.28% over seven days and -7.19% over 30 days. The most striking data point across both markets is volume, which registered at just 0.25x the seven-day average for BTC and 0.22x for ETH — a clear signal of participation withdrawal. Momentum readings diverge: BTC's RSI(14) sits at 38.9, while ETH's 28.5 places it in oversold territory. Both assets trade below their 7-day and 30-day moving averages.
Bitcoin Analysis
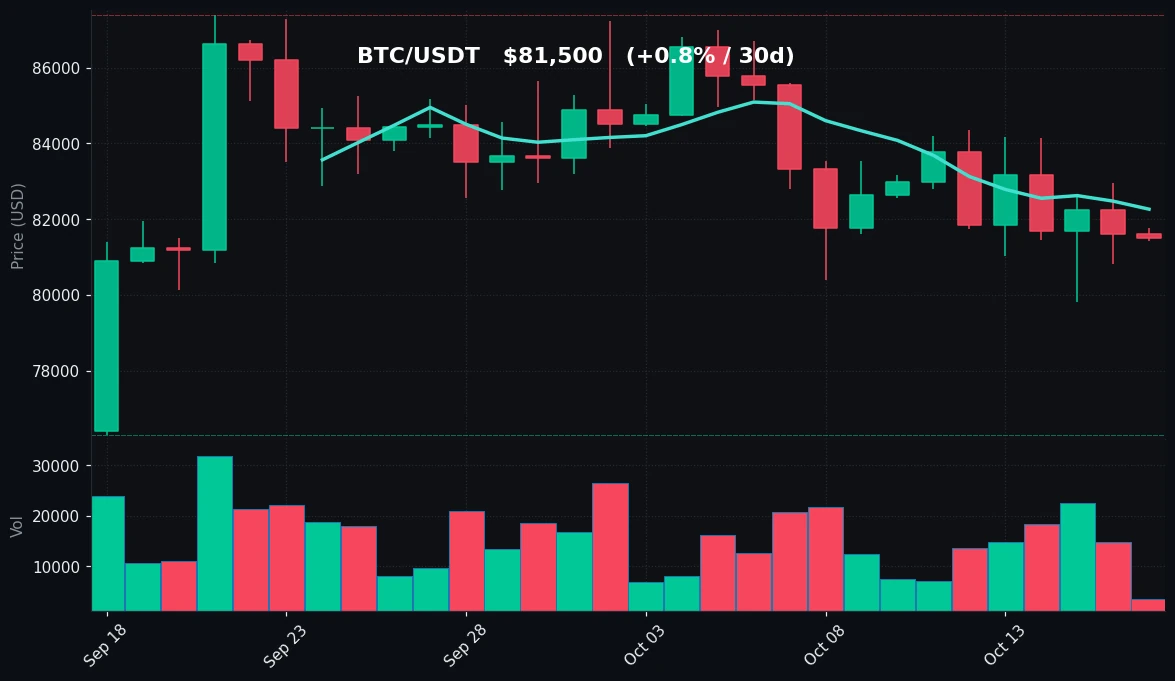
TradingView Live (4h)
Bitcoin's structure on 2026-10-17 is best characterized as compressed and listless. At $81,500, price is trading beneath both the MA7 at $82,262 and the MA30 at $83,576, a configuration that keeps the short-term trend bias tilted modestly lower. The gap between spot and the 7-day average is roughly $762, or just under 1%, indicating that the recent drift has been orderly rather than disorderly. The 30-day moving average sits about $2,076 above spot, which frames the broader context: BTC has spent recent sessions consolidating below its medium-term mean rather than breaking down from it.
The intraday range tells the more important story. With a high of $81,770 and a low of $81,416, the entire 24-hour band spans only $354 — approximately 0.43% of spot price. That is an unusually tight envelope and reflects a market in balance, with neither buyers nor sellers willing to press. The 7-day range is considerably wider at $79,800–$84,352, a $4,552 spread that shows the past week contained real movement even as the last session did not. The 30-day range of $76,296–$87,396 captures an $11,100 sweep, underscoring that October has been a month of significant two-way travel now resolving into consolidation.
Volume is the standout metric. At 0.25x the 7-day average, participation is roughly a quarter of what it has been recently. Thin volume during consolidation carries a specific interpretive weight: it suggests the recent drift lower has not been driven by aggressive distribution, but equally that there is little accumulation interest at current levels. Low-volume ranges are inherently fragile, though the data here does not indicate which way resolution will occur.
Momentum is soft but not extreme. RSI(14) at 38.9 sits below the neutral 50 line but comfortably above the 30 oversold threshold. This positions BTC in a mildly bearish momentum regime without the exhaustion characteristics of a washed-out market. Notably, price is holding roughly $1,700 above the 7-day low of $79,800, and the $76,296 30-day low remains a distant reference. The immediate technical picture places resistance at the MA7 ($82,262) and then the MA30 ($83,576), with support anchored near the $79,800 weekly floor.
Ethereum Analysis
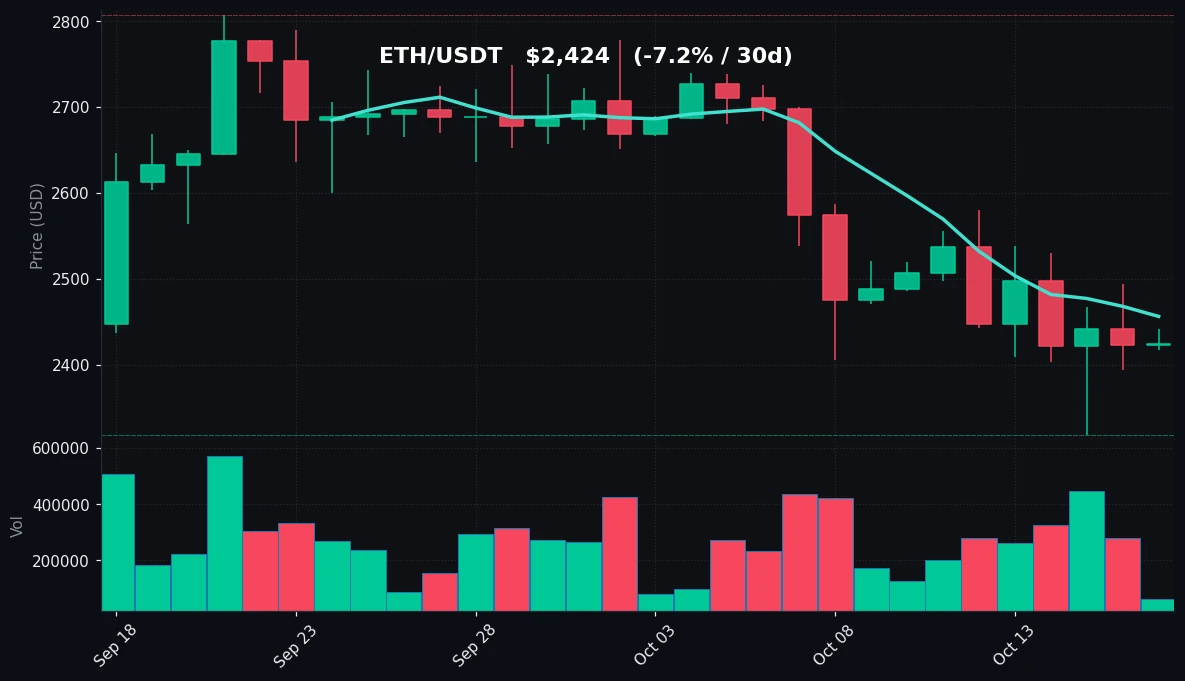
TradingView Live (4h)
Ethereum's tape on 2026-10-17 is quieter still, with ETH/USDT at $2,424 and a 24-hour change of +0.04% — a statistical flat line. The intraday range of $2,418–$2,442 spans just $24, or approximately 1% of spot, mirroring Bitcoin's compressed behavior. Where ETH diverges is in the medium-term trend: -3.28% over seven days and -7.19% over 30 days represent a materially weaker trajectory than BTC's -1.79% and +0.76% over the same windows. Ethereum has underperformed on both horizons.
The moving average structure reinforces this. ETH trades below its MA7 of $2,456 and well below its MA30 of $2,612, with the latter roughly $188 — about 7.8% — above spot. That is a wider percentage gap than Bitcoin's equivalent measure, confirming that Ethereum's medium-term positioning is more extended to the downside. The 30-day high of $2,807 against the current $2,424 represents a drawdown of approximately 13.6% from the monthly peak, and notably the 30-day low of $2,318 is only about $106 below current price.
That proximity to the monthly floor is significant. ETH's 7-day low also printed at $2,318, meaning the same level has served as the floor across both the weekly and monthly windows. Price is currently holding roughly 4.6% above it. This confluence makes $2,318 the single most consequential support reference on the chart.
Volume at 0.22x the 7-day average is even lighter than Bitcoin's, indicating comparably subdued participation. The critical differentiator is momentum: RSI(14) at 28.5 places ETH firmly in oversold territory, below the 30 threshold. This is a meaningfully more stretched reading than BTC's 38.9 and suggests Ethereum's recent declines have carried more momentum force. Oversold conditions describe the speed and persistence of a move rather than its direction, and in a low-volume environment they can persist without immediate mean reversion. Resistance overhead begins at the MA7 ($2,456) and extends to the MA30 ($2,612).
Key Technical Levels
| Asset | Support | Resistance | RSI |
|---|---|---|---|
| BTC | $79,800 (7d low); $76,296 (30d low) | $82,262 (MA7); $83,576 (MA30); $84,352 (7d high) | 38.9 — neutral, below midline |
| ETH | $2,318 (7d and 30d low confluence) | $2,456 (MA7); $2,612 (MA30); $2,580 (7d high) | 28.5 — oversold |
BTC vs ETH Dynamic
The two majors are moving in near-lockstep on the day — BTC -0.14%, ETH +0.04% — but the correlation masks a persistent performance gap over longer horizons. ETH's 30-day return of -7.19% against BTC's +0.76% represents roughly an eight-percentage-point spread, and the seven-day figures (-3.28% vs -1.79%) show the same directional divergence at smaller scale. Both assets are trading below their MA7 and MA30, both are exhibiting volume at roughly a quarter of recent averages, and both are consolidating in unusually tight intraday ranges. The key asymmetry sits in momentum: ETH's RSI of 28.5 is oversold while BTC's 38.9 is merely soft, suggesting Ethereum has absorbed the heavier selling pressure in this phase. In practice, this means ETH carries more mean-reversion potential on a technical basis but also more downside sensitivity if the $2,318 floor gives way, while BTC's comparatively resilient 30-day return and higher RSI give it a marginally more balanced profile.
Strategy Fit
Today's data profile — compressed intraday ranges, volume at 0.22x–0.25x of the 7-day average, and RSI readings of 38.9 (BTC) and 28.5 (ETH) — describes a range-bound, low-participation market rather than a trending one. In such conditions, range-harvesting approaches tend to fit the observed volatility structure better than trend-following ones, since directional momentum is absent and price is oscillating within defined boundaries. BTC's $79,800–$84,352 weekly envelope and ETH's $2,318–$2,580 band provide the reference frames. Grid strategies are commonly deployed in exactly this kind of sideways, low-volume environment, as they seek to capture repeated oscillation between levels rather than a single directional move. For participants with a longer horizon, DCA-style accumulation is often discussed during consolidation phases, particularly where an asset is oversold — though ETH's oversold RSI is a description of current momentum, not a signal. Trend-following approaches are least aligned with today's tape given the absence of directional conviction. Pionex offers built-in bots — including grid trading and DCA bots — that automate these strategy types, and the platform's infrastructure is designed for exactly the kind of range conditions observed today. Strategy selection should always match individual risk tolerance and market conditions, which can change without notice.
Risk Disclaimer
This market recap is provided for informational and educational purposes only and does not constitute financial, investment, or trading advice. Nothing herein should be interpreted as a recommendation to buy, sell, or hold any asset. Cryptocurrency markets are highly volatile and carry substantial risk, including the possible loss of all capital. Technical indicators such as RSI, moving averages, and volume ratios describe historical and current conditions only; they are not predictive and should not be relied upon as forecasts. Automated trading bots, including those offered by Pionex, do not guarantee profits and can incur losses, particularly in rapidly changing markets. Past performance is not indicative of future results. Readers should conduct independent research and consult a qualified financial professional before making any investment decision.
FAQ
What was Bitcoin's price on 2026-10-17?
BTC/USDT traded at $81,500, down -0.14% over 24 hours, within an intraday range of $81,416 to $81,770.
Why is Ethereum's RSI significant today?
ETH's RSI(14) stands at 28.5, placing it in oversold territory below the 30 threshold. This reflects sustained downward momentum over the recent period, though oversold readings describe current conditions rather than predicting reversals.
What do the low volume figures indicate?
BTC volume is at 0.25x its 7-day average and ETH at 0.22x. This indicates substantially reduced trading participation relative to recent norms, consistent with a consolidation phase where neither buyers nor sellers are pressing aggressively.
What are the key support levels to watch?
For BTC, the 7-day low of $79,800 is the nearest support, with $76,296 as the 30-day floor. For ETH, $2,318 serves as both the 7-day and 30-day low — a notable confluence level currently about 4.6% below spot.
How has ETH performed relative to BTC recently?
ETH has underperformed across both windows: -3.28% over 7 days versus BTC's -1.79%, and -7.19% over 30 days versus BTC's +0.76%. Both assets, however, trade below their 7-day and 30-day moving averages.


