BTC ETH Daily Recap — 2026-10-24

BTC ETH Daily Recap — 2026-10-24
Today at a Glance
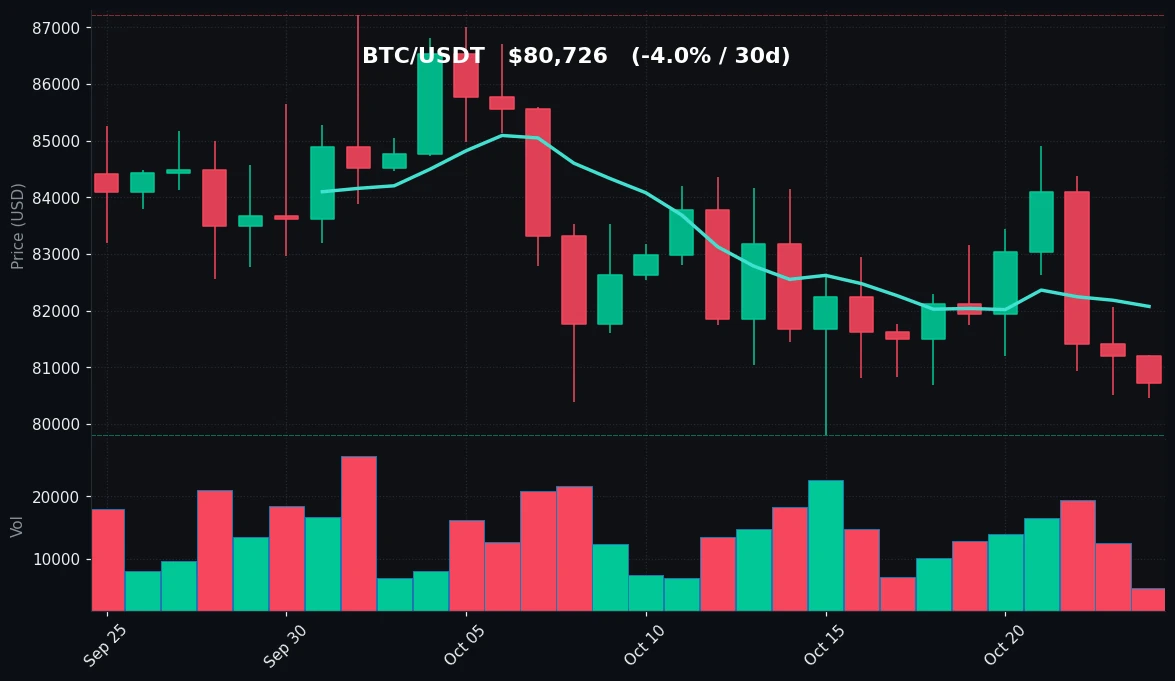
Bitcoin closed the session at $80,726, down 0.57% over 24 hours within a narrow $81,214–$80,451 range. The move extends a softer weekly trend: BTC is -0.94% on the 7-day and -4.01% on the 30-day, and it now trades below both its 7-day moving average ($82,072) and 30-day moving average ($83,228). Volume is the notable story — at 0.4x the 7-day average, participation has thinned considerably.
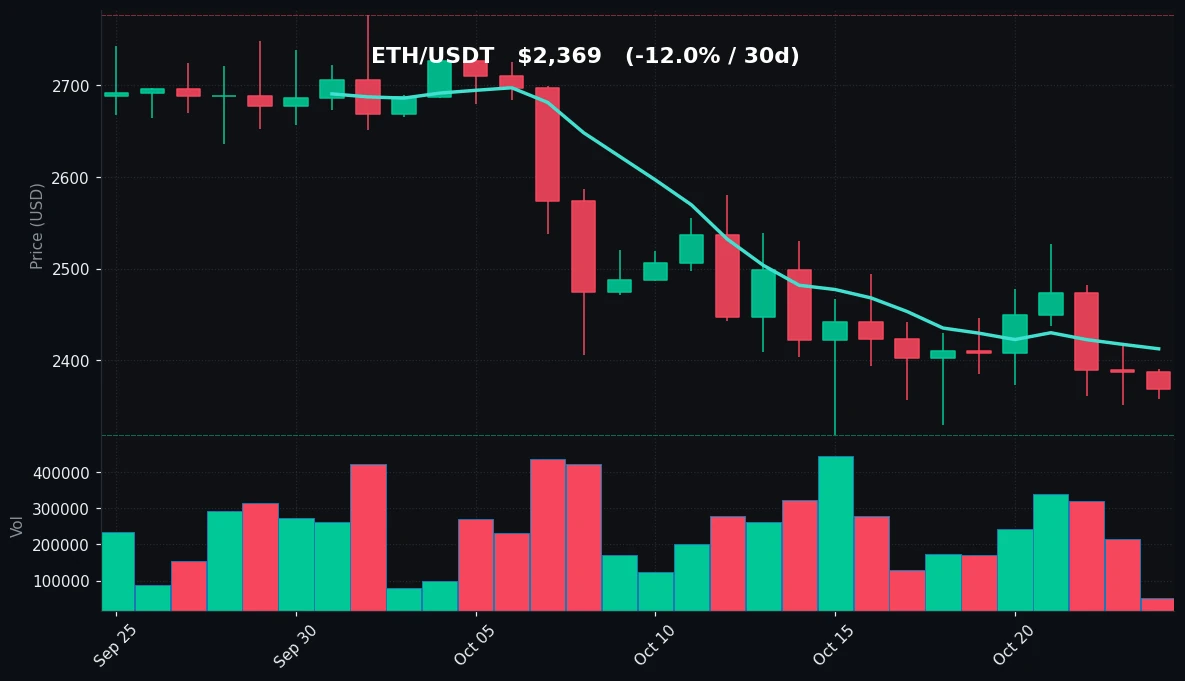
Ethereum is weaker on both absolute and relative terms. ETH changed hands at $2,369, -0.79% on the day, -1.42% on the week, and -11.99% over 30 days. It sits well beneath its MA7 of $2,412 and MA30 of $2,548, with RSI(14) at 35.9 — the lower of the two majors. Volume at 0.23x the 7-day average is exceptionally light, reinforcing the picture of a market in a low-conviction holding pattern rather than an active repricing.
Bitcoin Analysis
TradingView Live (4h)
Bitcoin's structure remains gently defensive. Price at $80,726 is positioned in the lower third of the 30-day range of $79,800–$87,220, and roughly $1,346 below the 7-day MA ($82,072) and $2,502 below the 30-day MA ($83,228). The ordering of price beneath both averages, with the shorter average beneath the longer one, describes a market that has been grinding lower rather than one that has broken down violently. The 7-day high of $84,898 marks the most recent failed recovery attempt; the 30-day high of $87,220 is the level that would need to be reclaimed to neutralize the current drift.
On the day, the $81,214 high and $80,451 low define a compressed $763 range — unusually tight for BTC — and the close near the lower end of that band suggests sellers held a modest edge into the settlement. The more consequential reference is the 30-day low at $79,800, which sits just below current price and represents the nearest meaningful floor. Between $79,800 and $80,451 the market has a thin cushion of prior demand; a sustained hold above that zone keeps the range structure intact.
Momentum is soft but not stretched. RSI(14) at 41.4 is below the neutral 50 line and in the lower half of the neutral band, yet comfortably above the conventional 30 oversold threshold. That combination — sub-neutral momentum without capitulation — is characteristic of a controlled pullback. There is no momentum divergence signal in the data provided, and no evidence of the kind of exhaustion reading that typically accompanies a washout.
The volume figure is arguably the most informative input. At 0.4x the 7-day average, BTC is trading on roughly two-fifths of its recent typical turnover. Low-volume declines carry less informational weight than high-volume ones: they often reflect an absence of buyers rather than aggressive supply. That distinction matters for how the range is interpreted, but it does not by itself resolve direction. What it does indicate is a market where liquidity is thin and where a modest flow imbalance can move price disproportionately — a condition that argues for wider stops and smaller position sizing rather than for conviction trades.
Taken together, BTC is best described as range-bound with a mild downward bias: price below both moving averages, RSI in the low-neutral zone, volatility compressed on the session, and volume materially below trend. The key levels to monitor are $79,800 (30-day low) as the structural floor and $82,072–$83,228 (the moving average cluster) as the overhead repair zone.
Ethereum Analysis
TradingView Live (4h)
Ethereum's chart is weaker than Bitcoin's on nearly every metric in the dataset. At $2,369, ETH sits $43 below its 7-day MA ($2,412) and $179 below its 30-day MA ($2,548) — a wider percentage gap to the longer average than BTC exhibits. The 30-day performance of -11.99% is roughly three times BTC's -4.01%, confirming that the relative underperformance is a persistent trend rather than a single-session artifact. ETH is also positioned in the bottom portion of its 30-day range of $2,318–$2,777, trading just $51 above the range low.
The daily range was tight — $2,390 high against a $2,357 low, a $33 spread — and the close at $2,369 landed in the lower half. The 7-day low of $2,329 and the 30-day low of $2,318 form a closely stacked support cluster within about 2% of spot. That proximity is the central technical fact for ETH: price is pressing against a defined floor, and the outcome at that zone carries more weight than intraday noise. The 7-day high of $2,527 is the nearest meaningful resistance, with the MA30 at $2,548 sitting just above it — a confluence that makes $2,527–$2,548 the first real test of any recovery attempt.
RSI(14) at 35.9 is the weakest reading in this recap. It is approaching — but has not reached — the 30 oversold line. In practical terms, ETH is in a low-neutral-to-oversold transition zone where downside momentum is persistent but not yet at the extreme that historically precedes mean-reversion bounces. As with BTC, the data shows no confirmed reversal signal; it shows sustained softness.
Volume is the standout: 0.23x the 7-day average is extraordinarily light, less than a quarter of recent typical activity. For an asset that has fallen nearly 12% over 30 days, the absence of elevated volume on the decline is notable. It suggests the move has been driven by lack of bids rather than heavy distribution — a distinction that leaves the market susceptible to sharp, low-liquidity moves in either direction. Thin books amplify both rallies and selloffs.
Structurally, ETH is a downtrend in a compressed consolidation near range lows: price below both MAs, RSI at 35.9, volatility narrow, and volume near a multi-day trough. The levels that matter are $2,318–$2,329 on the downside and $2,527–$2,548 overhead.
Key Technical Levels
| Asset | Support | Resistance | RSI |
|---|---|---|---|
| BTC | $79,800 (30d low); $80,451 (24h low) | $82,072 (MA7); $83,228 (MA30); $84,898 (7d high) | 41.4 — neutral, lower half |
| ETH | $2,318 (30d low); $2,329 (7d low) | $2,412 (MA7); $2,527 (7d high); $2,548 (MA30) | 35.9 — neutral, approaching oversold |
BTC vs ETH Dynamic
The two majors are moving in the same direction but not with the same force. Both are down on the day (BTC -0.57%, ETH -0.79%), both are down on the week and month, and both trade below their 7- and 30-day moving averages — a high directional correlation in sign. The divergence is in magnitude: ETH's 30-day drawdown of -11.99% versus BTC's -4.01% means the beta relationship is working asymmetrically to the downside, with ETH absorbing roughly three times the relative loss. That pattern — BTC as the relative safe harbor within the pair, ETH as the higher-beta expression — is consistent with a risk-off posture among crypto participants rather than asset-specific news. Notably, both assets show sub-trend volume (BTC 0.4x, ETH 0.23x), so the correlation is being expressed in a thin market where both are drifting on light flow. ETH's lower RSI (35.9 vs 41.4) reflects that it has traveled further along the same path, not that it is moving independently.
Strategy Fit
Today's data describes a low-volatility, low-volume, mildly bearish range — an environment that rewards patience and range-awareness over directional conviction. BTC's $763 daily range and ETH's $33 range are compressed, and volume at 0.4x and 0.23x of the 7-day average means breakouts are more likely to fail without a volume expansion to confirm them.
For range-bound conditions like these, grid strategies are a natural structural fit: they monetize oscillation between defined bounds rather than requiring a directional call. A grid anchored between the identified support and resistance zones — for BTC roughly $79,800–$83,228, for ETH roughly $2,318–$2,548 — is the kind of setup that suits compressed, mean-reverting price action, though thin liquidity means grid spacing should be wider than in normal conditions to avoid over-trading. Pionex's built-in grid bots are designed for exactly this use case and allow parameters to be set around observed levels.
For participants with a longer horizon, DCA is the lower-complexity alternative: with RSI at 41.4 (BTC) and 35.9 (ETH), neither asset is at an extreme, but both are in the lower half of their ranges, which is the zone where scheduled accumulation tends to be considered. Pionex offers built-in DCA bots for automated, interval-based entry.
Trend-following strategies are the poorest fit today. Price is below both moving averages on both assets, but volume provides no confirmation of a directional break, and RSI is neither oversold enough for a reversal play nor strong enough for momentum continuation. Pionex's futures grid and trend-oriented bots remain available, but the current tape — narrow ranges, sub-trend volume — does not present the sustained directional impulse those tools are built to capture. Position sizing should reflect the thin liquidity regardless of approach.
Risk Disclaimer
This recap is provided for informational and educational purposes only. It is not financial advice, investment advice, or a recommendation to buy, sell, or hold any asset. All figures are historical data as of 2026-10-24 and carry no predictive value. Cryptocurrency markets are highly volatile and can result in total loss of capital. Technical indicators such as RSI and moving averages describe past price behavior and do not forecast future outcomes. Automated strategies, including grid and DCA bots, carry risk of loss and do not guarantee profit. Consult a qualified financial professional and conduct your own research before making any decision.
FAQ
What was Bitcoin's price on 2026-10-24?
BTC/USDT traded at $80,726, down 0.57% over 24 hours, with a session range of $80,451–$81,214.
How did Ethereum perform over the same period?
ETH/USDT closed at $2,369, down 0.79% on the day, -1.42% on the week, and -11.99% over 30 days.
What do the RSI readings indicate?
BTC's RSI(14) is 41.4 and ETH's is 35.9. Both sit in the neutral band below the 50 midline; ETH is closer to the conventional 30 oversold threshold but has not reached it.
Why is volume significant in this recap?
BTC volume is 0.4x and ETH 0.23x their respective 7-day averages. Sub-trend volume suggests the recent drift reflects thin participation rather than aggressive selling, and it raises the risk of outsized moves in either direction.
Which strategy type fits the current market?
The compressed ranges and light volume favor range-based approaches such as grid strategies, or scheduled accumulation via DCA for longer horizons. Pionex offers built-in bots for both. Trend-following is less suited to the current tape. This is not financial advice.


