BTC ETH Daily Recap — 2026-10-28

BTC ETH Daily Recap — 2026-10-28
Today at a Glance
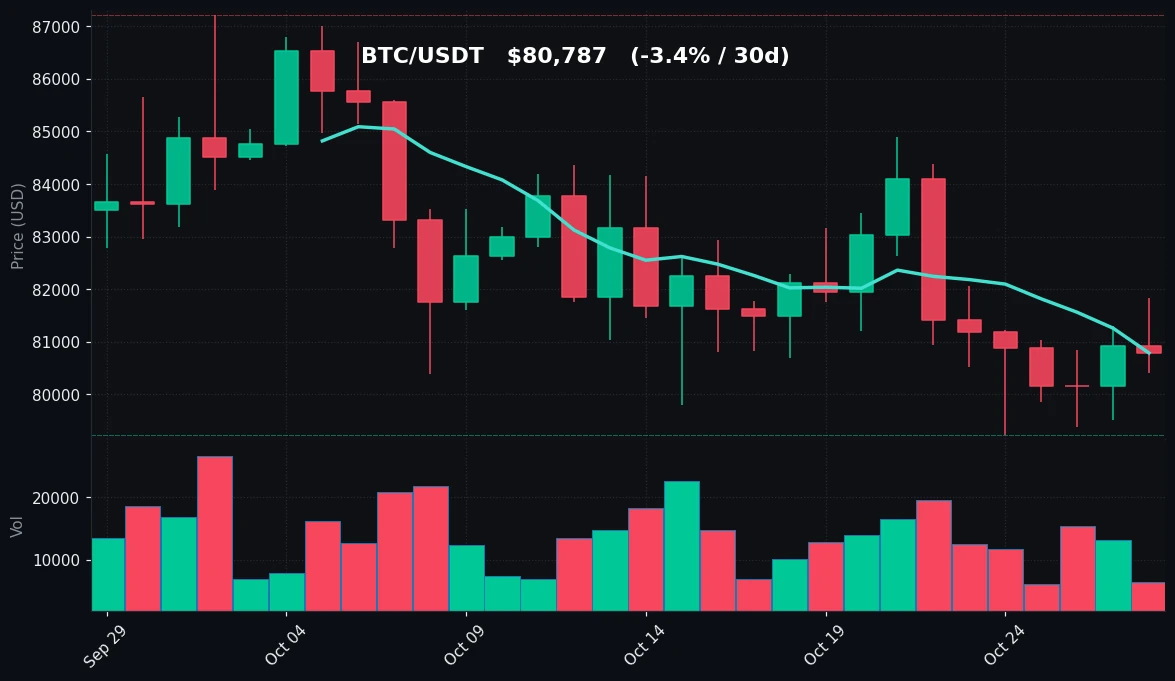
Bitcoin is trading at $80,787, essentially flat over the past 24 hours with a marginal decline of 0.15%, confined to a narrow intraday range between $80,397 and $81,823. The longer-term picture is softer: BTC is down 3.93% on the week and 3.44% over 30 days, having slipped below its 30-day moving average of $82,749 while sitting almost exactly on its 7-day MA of $80,785. Volume is notably light at 0.48x the 7-day average, and RSI(14) at 45.1 places momentum in neutral territory, just below the midline.
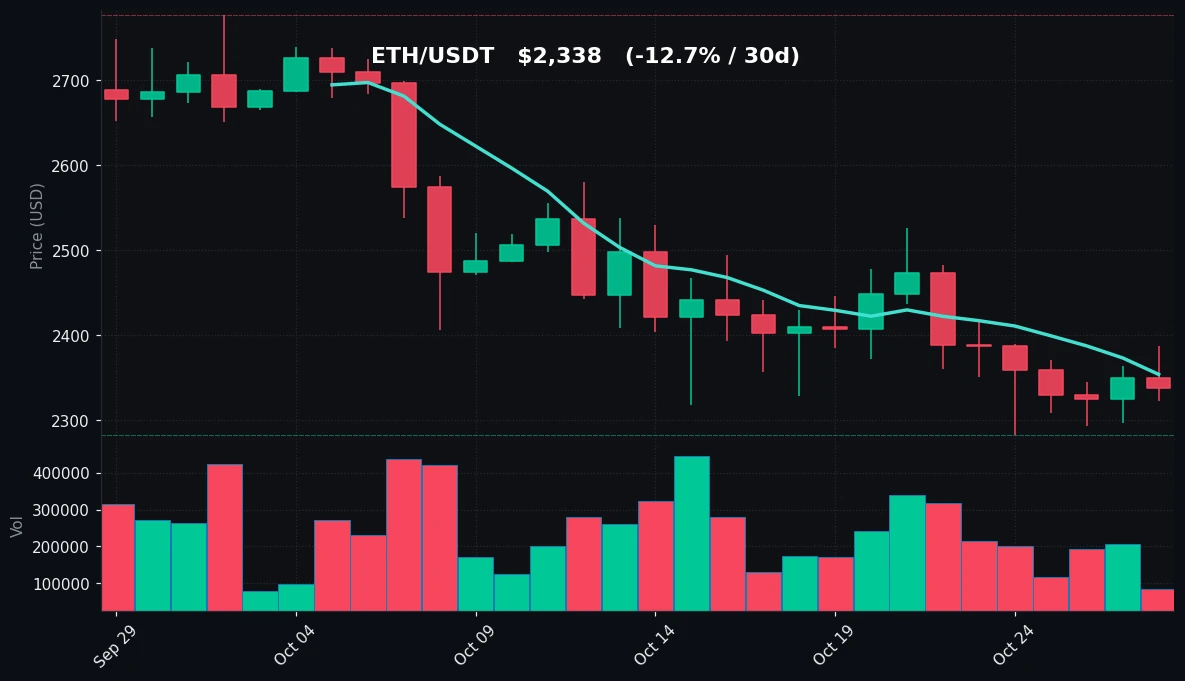
Ethereum is weaker across every timeframe. At $2,338, ETH is down 0.51% in 24 hours, 5.47% on the week, and 12.68% over 30 days. It trades below both its 7-day MA ($2,354) and 30-day MA ($2,500), with RSI(14) at 37.1 — approaching oversold but not yet there. Volume is even thinner than BTC's at 0.37x the 7-day average, signaling a market in wait-and-see mode rather than active distribution.
Bitcoin Analysis
TradingView Live (4h)
Bitcoin's price structure on 2026-10-28 is best described as consolidation within a mild downtrend. The asset last printed $80,787, having spent the session in a tight $1,426 band between $80,397 and $81,823 — a range of roughly 1.8%, which is compressed relative to the broader weekly swing. That weekly range spans from a low of $79,221 to a high of $84,377, a spread of more than 6%, indicating that the past seven sessions contained considerably more directional movement than the last 24 hours. The 30-day window is wider still, with a high of $87,220 against the same $79,221 low, a drawdown of approximately 9.2% from peak to trough.
The moving average configuration is mildly bearish. BTC trades marginally above its 7-day MA of $80,785 — a difference of just $2, effectively a touch — while sitting about 2.4% below the 30-day MA of $82,749. This arrangement, with the shorter MA below the longer one and price pinned to the short MA, reflects a market that has lost upward momentum without yet breaking down decisively. The $79,221 level, which serves as both the 7-day and 30-day low, is the clearest structural support in the dataset; it has held on a closing basis through the recent pullback. To the upside, the 30-day MA at $82,749 and the 7-day high of $84,377 form successive layers of resistance.
Volume behavior is the most telling signal in today's data. At 0.48x the 7-day average, participation is roughly half of what it has been recently. Low-volume consolidation near support often reflects exhaustion of selling pressure rather than conviction in either direction, though it can also precede a volatility expansion. RSI(14) at 45.1 is neutral — below the 50 midline but well above the 30 oversold threshold — consistent with a market that has corrected without capitulating. There is no divergence signal available in the provided data, and no momentum extreme to anchor a directional bias.
Taken together, BTC is in a holding pattern: price is range-bound, volatility is compressed on the day, volume is light, and momentum is neutral. The key levels to monitor are $79,221 as structural support and $82,749 as the first meaningful resistance. No directional outcome is implied by these readings; the market is simply balanced within a slightly lower range than a month ago.
Ethereum Analysis
TradingView Live (4h)
Ethereum's technical picture is weaker than Bitcoin's on every metric in today's dataset. ETH changed hands at $2,338, down 0.51% over 24 hours within a session range of $2,323 to $2,388 — a spread of about 2.8%. The weekly decline of 5.47% and the 30-day decline of 12.68% are both substantially larger than BTC's corresponding figures, and the 30-day range tells the story of a persistent slide: from a high of $2,777 down to a low of $2,282, a peak-to-trough drawdown of roughly 17.8%. The weekly high of $2,482 and low of $2,282 confirm that the recent low sits at the very bottom of both the 7-day and 30-day ranges, meaning ETH is trading near its monthly floor.
The moving averages reinforce the downtrend. ETH is about 0.7% below its 7-day MA of $2,354 and roughly 6.5% below its 30-day MA of $2,500. Both averages are declining and stacked above price, a classic bearish alignment. The gap between price and the 30-day MA is wide enough to suggest that the recent decline has been sustained rather than a single-session flush.
Momentum is softer than BTC's as well. RSI(14) at 37.1 is in the lower-neutral zone, approaching but not reaching the 30 oversold threshold. This is consistent with persistent selling pressure that has not yet produced an exhaustion signal. Volume at 0.37x the 7-day average is the thinnest reading in today's dataset — thinner even than BTC's already-light 0.48x — which suggests that the decline has occurred on fading participation rather than heavy distribution. Thin volume during a downtrend can indicate seller fatigue, but it equally reflects absent demand; the data does not distinguish between the two.
Structurally, the critical level is $2,282, the confluence of the 7-day and 30-day low. A hold above this zone keeps the range intact; the first resistance overhead is the 7-day MA at $2,354, followed by the weekly high of $2,482 and then the 30-day MA at $2,500. ETH's underperformance relative to BTC — 5.47% versus 3.93% on the week, and 12.68% versus 3.44% on the month — is the defining feature of the current tape. As with BTC, no directional forecast is warranted from these readings; the data describes a market trading near range lows with weak but not extreme momentum and light volume.
Key Technical Levels
| Asset | Support | Resistance | RSI |
|---|---|---|---|
| BTC | $79,221 | $82,749 | neutral (45.1) |
| ETH | $2,282 | $2,354 | neutral (37.1) |
Note: BTC's support reflects the 7-day/30-day low confluence; resistance reflects the 30-day MA, with the 7-day high of $84,377 as a secondary level. ETH's support reflects the 7-day/30-day low confluence; resistance reflects the 7-day MA, with $2,482 and $2,500 above.
BTC vs ETH Dynamic
BTC and ETH are moving in the same direction but at different magnitudes, a pattern consistent with high positive correlation during risk-off phases. Both assets are below their 30-day moving averages, both printed their 30-day lows at the same structural point in the recent past, and both show neutral-to-weak RSI with sub-average volume. The divergence is in relative strength: ETH has lost 12.68% over 30 days against BTC's 3.44%, and its RSI at 37.1 sits nearly eight points below BTC's 45.1. This kind of beta asymmetry — where the higher-beta asset falls harder while the market leader consolidates — typically indicates that capital is rotating toward relative safety within the crypto complex rather than exiting entirely. The correlation remains intact; the spread is one of degree, not direction.
Strategy Fit
Today's conditions — compressed intraday ranges, below-average volume on both assets, neutral RSI, and price pinned near well-defined range lows — are characteristic of a range-bound market rather than a trending one. In such environments, mean-reversion approaches tend to fit the observed data better than trend-following ones, though this is a description of current conditions rather than a recommendation. Grid strategies, which profit from oscillation within a defined band, are structurally aligned with the $79,221–$82,749 BTC range and the $2,282–$2,354 ETH range visible in the data. Dollar-cost averaging suits participants who prefer to accumulate through consolidation without timing entries. Trend strategies would require a confirmed break of either range boundary — something today's light volume does not provide. Pionex offers built-in bots, including grid trading and DCA bots, that automate these approaches; users should configure ranges and sizing based on their own risk tolerance and the levels identified above.
Risk Disclaimer
This recap is provided for informational purposes only and does not constitute financial advice, investment advice, or a recommendation to buy or sell any asset. Cryptocurrency markets are highly volatile and can result in the loss of all invested capital. Past performance and technical indicators are not reliable predictors of future results. All data is as reported for 2026-10-28 and may be subject to revision. Readers should conduct their own research and consult a qualified financial professional before making any investment decision.
FAQ
What was Bitcoin's price on 2026-10-28?
BTC traded at $80,787, down 0.15% over 24 hours, within a session range of $80,397 to $81,823.
How did Ethereum perform compared to Bitcoin?
ETH underperformed across all timeframes: -0.51% on the day, -5.47% on the week, and -12.68% over 30 days, versus BTC's -0.15%, -3.93%, and -3.44% respectively.
What do the RSI readings indicate?
BTC's RSI(14) of 45.1 and ETH's 37.1 both sit in neutral territory — below the 50 midline but above the 30 oversold threshold. Neither asset shows an extreme momentum reading.
What are the key support and resistance levels?
BTC support is $79,221 with resistance at $82,749 (30-day MA). ETH support is $2,282 with resistance at $2,354 (7-day MA).
Why is volume relevant in today's data?
BTC volume is 0.48x and ETH volume is 0.37x their respective 7-day averages, indicating light participation and a consolidating rather than trending market.


