BTC ETH Daily Recap — 2026-11-01

BTC ETH Daily Recap — 2026-11-01
Today at a Glance
Both major assets printed modest green candles over the past 24 hours, but the bounce does little to repair a difficult month. BTC trades at $77,934, up +0.45% on the day within a tight $77,517–$78,285 range, yet remains -2.77% over seven days and -8.05% over 30 days. ETH sits at $2,265, +0.42% in 24 hours, but -2.78% weekly and -15.71% monthly — a notably deeper drawdown than BTC.
The more telling signal is participation. Volume versus the 7-day average is just 0.28x for BTC and 0.22x for ETH, meaning this stabilization is occurring on thin flow rather than conviction buying. Both assets trade below their 7-day and 30-day moving averages, and RSI(14) readings of 32.6 (BTC) and 31.2 (ETH) sit just above the oversold threshold. ETH's monthly high of $2,740 versus its current $2,265 underscores how much ground has been given back.
Bitcoin Analysis
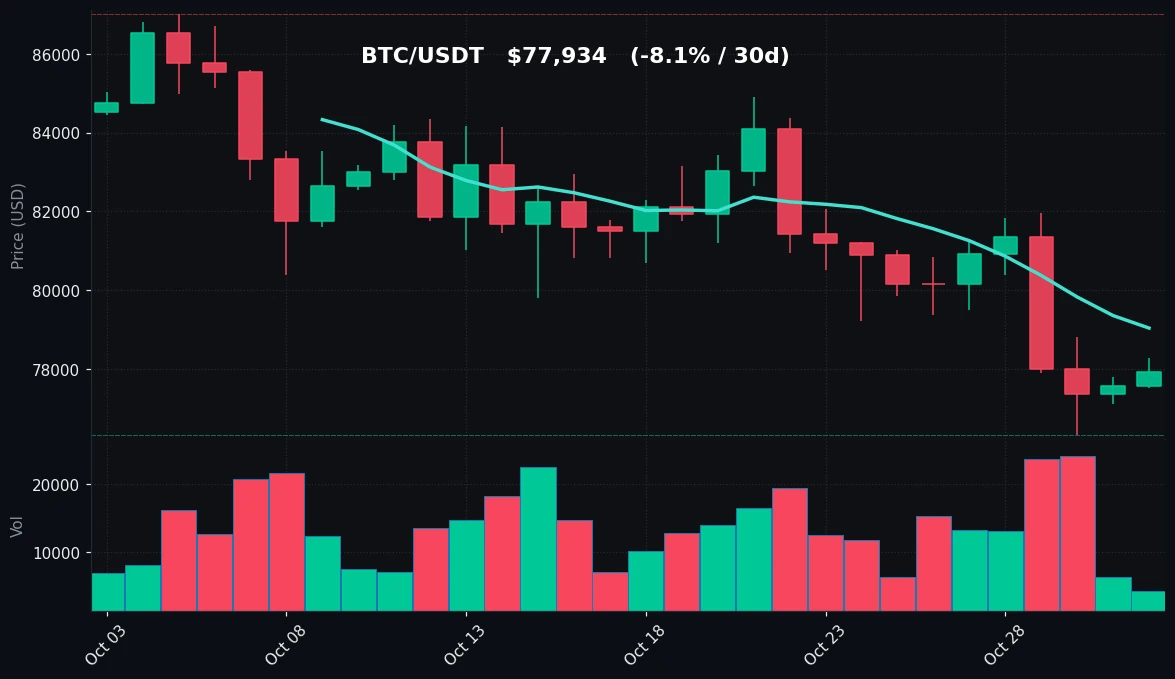
TradingView Live (4h)
BTC's trend structure remains corrective across every timeframe in the dataset. Price at $77,934 is below the MA7 of $79,040 and well below the MA30 of $81,908, with the moving averages stacked in bearish order — short-term below longer-term. That configuration typically signals that the recent path of least resistance has been lower, and today's +0.45% move has not yet challenged even the 7-day average, let alone the 30-day.
Key technical levels are clearly defined by recent price action. On the downside, the 7-day low of $76,326 coincides with the 30-day low — a double-tested floor that carries technical weight as the line separating consolidation from a fresh leg lower. Below that, there is no nearby reference in the provided data, which makes the $76,326 level the single most important support to monitor. On the upside, immediate resistance sits at the MA7 ($79,040), followed by the 7-day high of $81,971 and then the MA30 ($81,908), which cluster tightly together — a reclaim of that $81,900–$82,000 zone would be required to neutralize the short-term bearish structure. The 30-day high of $86,999 marks the upper boundary of the broader range.
Volume is the standout observation. At 0.28x the 7-day average, participation is severely depressed. Low-volume drift can cut both ways: it reflects exhaustion of selling pressure, but it also means rallies lack fuel and can reverse quickly. In practical terms, price moves during such conditions carry less informational value than moves made on expanding volume.
Momentum is soft but not extreme. RSI(14) at 32.6 is in bearish territory and approaching — but not inside — oversold conditions (conventionally sub-30). This suggests persistent selling pressure without the kind of capitulation reading that often accompanies durable lows. The combination of price below both MAs, RSI in the low 30s, and anemic volume describes a market that is consolidating near the bottom of its recent range rather than one that has confirmed a reversal. The 24-hour range of just $768 (roughly 1% of price) reinforces the compression picture.
Ethereum Analysis
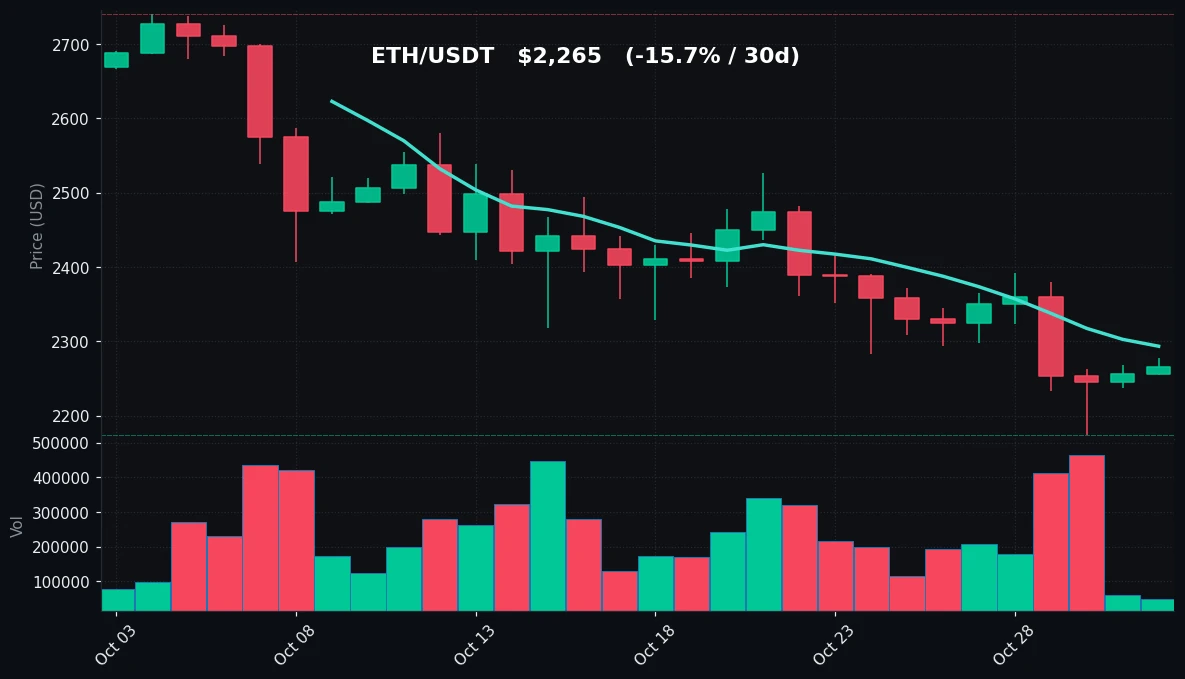
TradingView Live (4h)
ETH's technical picture mirrors BTC's but with greater severity. At $2,265, ETH is below the MA7 of $2,293 and far below the MA30 of $2,443, with the same bearish MA stacking. The 30-day decline of -15.71% is nearly double BTC's -8.05%, confirming that ETH has underperformed on the downside over the month — a pattern consistent with higher-beta behavior during risk-off phases.
Support is anchored at the 7-day low of $2,174, which is also the 30-day low — the same double-test structure seen in BTC. That $2,174 level is the critical line in the sand. Resistance is layered: first the MA7 at $2,293, just $28 above spot, then the 7-day high of $2,392, and then the MA30 at $2,443. The 30-day high of $2,740 sits far above and highlights the magnitude of the retracement — ETH is roughly 17% below its monthly peak.
The 24-hour range is remarkably narrow: $2,255 to $2,278, a span of just $23, or about 1% of price. Combined with volume at only 0.22x the 7-day average — even thinner than BTC's — this is a market in a low-conviction holding pattern. The intraday high of $2,278 failed to reach even the MA7, indicating sellers remain active on minor rallies.
RSI(14) at 31.2 is marginally lower than BTC's 32.6, placing ETH closer to the oversold threshold without crossing it. The reading is consistent with sustained downward momentum that has yet to exhaust itself by the standard measure. Notably, ETH's monthly drawdown, sub-MA positioning, and near-oversold RSI collectively describe a weaker relative structure than BTC's, even though today's percentage gains are nearly identical (+0.42% vs +0.45%). The near-identical daily moves against divergent monthly performance is itself informative about how tightly the two assets are currently correlated on short horizons while diverging over longer ones.
Key Technical Levels
| Asset | Support | Resistance | RSI |
|---|---|---|---|
| BTC | $76,326 (7d/30d low) | $79,040 (MA7) / $81,908–$81,971 (MA30 & 7d high) | 32.6 — near oversold, bearish |
| ETH | $2,174 (7d/30d low) | $2,293 (MA7) / $2,443 (MA30) | 31.2 — near oversold, bearish |
BTC vs ETH Dynamic
The two assets are moving in near lockstep on the daily timeframe: +0.45% versus +0.42%, with both sitting below their MA7 and MA30 and both showing RSI in the low 30s. That tight short-term correlation reflects the current macro-driven, risk-off tone in which large-cap crypto trades as a single risk bucket rather than on individual fundamentals. The divergence appears over longer horizons — ETH's -15.71% 30-day performance against BTC's -8.05% shows ETH carrying roughly twice the downside beta during this drawdown, a classic pattern when capital rotates toward the relative safety of BTC in defensive phases. Volume ratios (0.28x BTC vs 0.22x ETH) reinforce that ETH's liquidity is thinner today, which can amplify moves in either direction once flow returns. For now, the pair is effectively one trade with different volatility profiles.
Strategy Fit
Today's conditions — compressed intraday ranges (~1% for both assets), volume at roughly a quarter of the 7-day average, RSI near but not at oversold, and price pinned below short-term moving averages — describe a range-bound, low-conviction market. That environment is generally more hospitable to range-harvesting approaches than to trend-following, since there is no confirmed directional momentum in either direction and breakouts on such thin volume are prone to failure.
Grid strategies, which profit from oscillation within a defined band, fit the current structure of repeated tests of well-defined support ($76,326 BTC / $2,174 ETH) and resistance (MA7 levels) — though traders should note that grids carry inventory risk if price breaks the range. DCA-style accumulation appeals to those treating the proximity to 30-day lows and near-oversold RSI as a value zone, accepting that further downside toward support is possible. Trend strategies have little to work with until price reclaims the MA7 and volume expands. Pionex offers built-in bots — including Grid Trading, DCA, and Rebalancing bots — that automate these approaches, and its futures grid and smart trade tools can help manage the defined levels noted above. Strategy selection should match individual risk tolerance and time horizon.
Risk Disclaimer
This recap is provided for informational purposes only and does not constitute financial, investment, or trading advice. Cryptocurrency markets are highly volatile, and past performance — including the price levels, RSI readings, and volume data cited above — is not indicative of future results. Digital assets can lose value rapidly, and leveraged products can result in losses exceeding deposits. Readers should conduct independent research, consider their own financial circumstances, and consult a qualified professional before making any trading decisions. The author holds no position in the assets discussed and receives no compensation from any platform mentioned.
FAQ
What does BTC's RSI of 32.6 indicate?
An RSI(14) of 32.6 places BTC in bearish territory, approaching but not yet inside the conventional oversold threshold of 30. It reflects sustained selling pressure without a textbook capitulation reading.
Why is volume so low today?
BTC volume is at 0.28x its 7-day average and ETH at 0.22x, indicating depressed participation. Low-volume moves carry less conviction and can reverse more easily than moves made on expanding flow.
What are the most important levels to watch?
For BTC, support at $76,326 (the 7d/30d low) and resistance at the MA7 of $79,040, then the $81,908–$81,971 cluster. For ETH, support at $2,174 and resistance at the MA7 of $2,293, then the MA30 of $2,443.
Why has ETH underperformed BTC over 30 days?
ETH is down -15.71% over 30 days versus BTC's -8.05%, consistent with ETH's higher beta during risk-off phases when capital rotates toward BTC's relative liquidity and stability.
Does this recap contain price predictions?
No. All figures are historical data points as of 2026-11-01. The analysis describes current structure and levels only and makes no forecasts about future prices.


