BTC ETH Daily Recap — 2026-10-26

BTC ETH Daily Recap — 2026-10-26
Today at a Glance
Bitcoin enters the final week of October trading at $79,607, down 0.68% over the past 24 hours within a narrow $79,369–$80,575 intraday band. The modest daily decline extends a softer weekly picture: BTC is down 2.85% over seven days and 5.76% over 30 days, and it is currently sitting below both its 7-day moving average ($81,482) and 30-day moving average ($82,940). Volume is notably thin at 0.66x the 7-day average, and RSI(14) at 40.3 places momentum in neutral-to-weak territory without reaching oversold conditions.
Ethereum is under more visible pressure. At $2,299, ETH is down 1.31% on the day, 4.51% on the week, and 14.48% over 30 days. The asset trades below its MA7 ($2,384) and MA30 ($2,522), with RSI(14) at 33.1 — close to, but not inside, oversold territory. Volume at 0.5x the 7-day average signals participation has thinned considerably. Both majors are consolidating near the lower end of their recent ranges, with ETH's relative weakness the more pronounced theme of the session.
Bitcoin Analysis
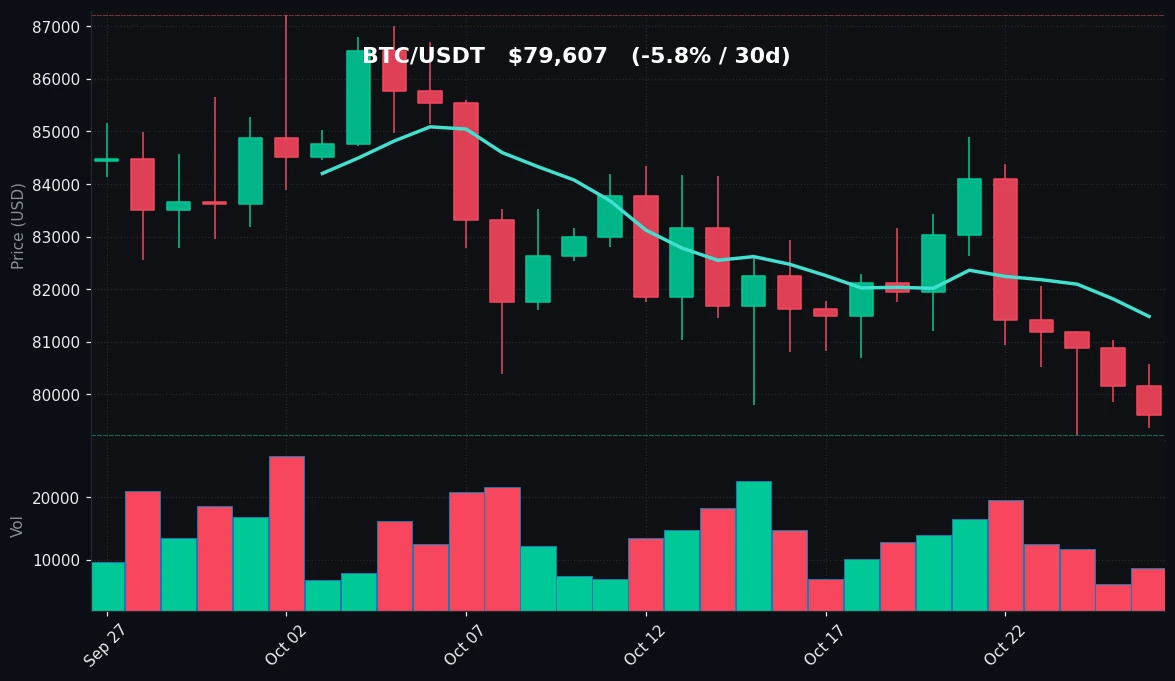
TradingView Live (4h)
Bitcoin's trend structure remains corrective rather than disorderly. The 7-day high of $84,898 and 30-day high of $87,220 establish a clear sequence of lower highs, while the 7-day low and 30-day low both register at $79,221 — a single, well-defined floor that has now been tested repeatedly. Today's range of $79,369 to $80,575 sits just above that floor, meaning BTC is compressing into the bottom of its recent range rather than breaking new ground in either direction.
The moving average configuration reinforces the soft tone. Price at $79,607 is roughly 2.3% below the MA7 of $81,482 and about 4.0% below the MA30 of $82,940, with the shorter average also below the longer one — a structure consistent with a market that has been drifting lower over the past month rather than trending decisively. For context, the 30-day range spans $79,221 to $87,220, and BTC is currently trading in the bottom 5% of that band.
On momentum, RSI(14) at 40.3 is neutral-to-weak. It is neither confirming a capitulation nor showing divergence signals visible from the raw reading; it simply reflects that selling pressure has been persistent but moderate. The more telling data point is volume: at 0.66x the 7-day average, today's activity is meaningfully below recent norms. Low-volume drift lower is typically a sign of absent demand rather than aggressive supply — though it also means the current price is less "confirmed" by participation.
Key technical levels to monitor are straightforward. On the downside, $79,221 is the reference support, with today's low of $79,369 effectively retesting it. A sustained hold above that zone would keep the range intact. On the upside, the MA7 at $81,482 is the first meaningful resistance, followed by the MA30 at $82,940 and the 7-day high at $84,898. Until price reclaims at least the MA7 on expanding volume, the technical picture remains one of range-bound consolidation near support.
Ethereum Analysis
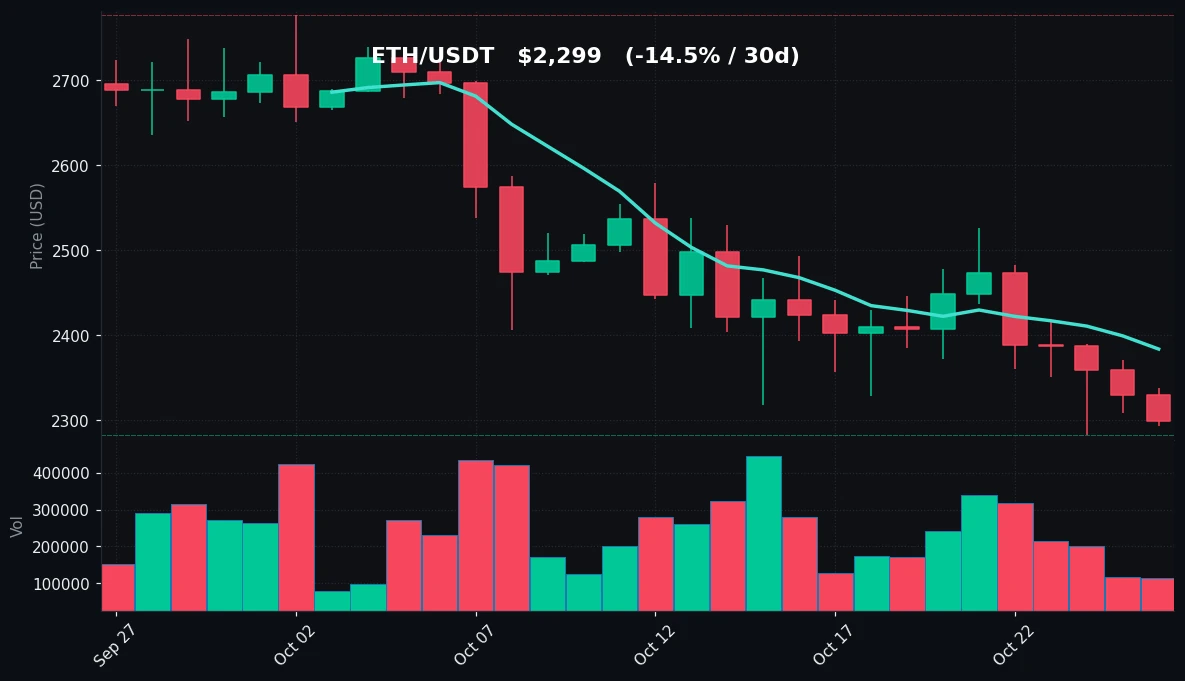
TradingView Live (4h)
Ethereum's technical picture is weaker than Bitcoin's on nearly every comparable metric. At $2,299, ETH is down 14.48% over 30 days versus BTC's 5.76% — a relative underperformance of roughly 8.7 percentage points. The 30-day range of $2,282 to $2,777 places ETH within about 1% of its monthly low, a far more pressured position than BTC's bottom-of-range posture.
The moving averages tell a consistent story. Price sits 3.6% below the MA7 of $2,384 and 8.8% below the MA30 of $2,522, with a wider gap between the two averages than BTC shows — evidence of a steeper recent downtrend. The 7-day high of $2,527 is now well overhead, and the fact that the 7-day low ($2,282) and 30-day low ($2,282) coincide confirms that ETH made its monthly low within the past week.
Momentum is the standout data point. RSI(14) at 33.1 is approaching the conventional 30 oversold threshold but has not crossed it. This matters for interpretation: ETH is weak, but the reading does not yet represent a washed-out condition. Combined with volume at just 0.5x the 7-day average — half of recent norms — the decline is occurring on declining participation. That combination (falling price, low volume, sub-35 RSI) describes a market in drift rather than active distribution.
Levels are clean. Support clusters at $2,282–$2,299, the monthly low and current price respectively. Resistance begins at the MA7 ($2,384), then the 7-day high ($2,527), with the MA30 ($2,522) sitting just below that weekly high and forming a dense resistance band around $2,520–$2,530. ETH would need to reclaim $2,384 on above-average volume to signal even a short-term stabilization; the broader 30-day trend remains negative until price challenges the $2,522–$2,527 zone.
Key Technical Levels
| Asset | Support | Resistance | RSI |
|---|---|---|---|
| BTC | $79,221 | $81,482 (MA7) / $82,940 (MA30) | 40.3 — neutral |
| ETH | $2,282 | $2,384 (MA7) / $2,522 (MA30) | 33.1 — neutral, approaching oversold |
BTC vs ETH Dynamic
The two majors are moving in the same direction but at different amplitudes, a classic high-beta relationship where ETH amplifies BTC's moves. Over 24 hours, BTC fell 0.68% while ETH fell 1.31% — roughly a 1.9x beta. Over 7 days the ratio is 1.6x (BTC -2.85%, ETH -4.51%), and over 30 days it widens to 2.5x (BTC -5.76%, ETH -14.48%). Correlation in direction is high, but the dispersion in magnitude is the more useful signal: capital is rotating out of the higher-beta asset faster than out of BTC. The volume data reinforces this — ETH at 0.5x its 7-day average versus BTC at 0.66x suggests liquidity is thinning more sharply on the ETH side. In practical terms, ETH's RSI (33.1) is lower than BTC's (40.3) despite both being in similar structural positions relative to their ranges, meaning ETH carries more downside momentum but also sits closer to a potential mean-reversion threshold. Neither asset is showing decoupling; this remains a single risk-on/risk-off market with ETH as the levered expression of BTC's direction.
Strategy Fit
Today's conditions — compressed ranges, thin volume, neutral-to-weak RSI on both assets, and price sitting near well-defined support — are characteristic of a consolidation regime rather than a trending one. BTC's 24-hour range was just 1.5% of price and ETH's 2.0%, both narrow by recent standards, while volume at 0.66x and 0.5x of the 7-day average confirms reduced participation. In such environments, range-bound strategies tend to fit the observed data better than trend-following ones, since there is no confirmed directional break on either asset.
For BTC, the repeated defense of the $79,221 floor and resistance at the MA7 ($81,482) define a workable band. Grid-style strategies are designed for exactly this kind of oscillation between defined levels, and Pionex's built-in grid bot allows parameters to be set around observed support and resistance rather than assumed ones. For ETH, the tighter proximity to support ($2,282) and the sub-35 RSI make a gradual accumulation approach — such as DCA — a structurally coherent fit for investors with a longer horizon, and Pionex offers a built-in DCA bot for scheduled, rule-based entries. Trend-following strategies have weaker justification today given both assets trade below their MA7 and MA30 with no reclaim signal; a trend approach would typically wait for a close above the MA7 on expanding volume. Whichever framework is used, position sizing should reflect that volume is running at roughly half to two-thirds of normal, which can exaggerate slippage in either direction. Pionex's bot suite covers grid, DCA, and trend-style execution, allowing the strategy to be matched to the regime rather than applied uniformly.
Risk Disclaimer
This recap is provided for informational purposes only and does not constitute financial advice, investment advice, or a recommendation to buy or sell any asset. Cryptocurrency markets are highly volatile and can result in the total loss of capital. Technical levels, RSI readings, and volume ratios describe past and current market conditions only; they are not predictions of future price movement. Automated strategies, including grid and DCA bots, carry risk of loss and do not guarantee profits. Readers should conduct their own research and consult a qualified financial professional before making any investment decision.
FAQ
What was BTC's price on 2026-10-26?
Bitcoin traded at $79,607, down 0.68% over 24 hours, with an intraday range of $79,369 to $80,575.
How did ETH perform compared to BTC?
ETH fell 1.31% on the day versus BTC's 0.68%, and 14.48% over 30 days versus BTC's 5.76% — underperforming on every measured timeframe.
Is ETH oversold?
Not yet by the conventional definition. ETH's RSI(14) is 33.1, above the 30 threshold, though it is closer to oversold than BTC's 40.3.
What are the key support levels right now?
BTC support sits at $79,221 (its 7-day and 30-day low); ETH support is at $2,282 (its 7-day and 30-day low).
Why is low volume significant in this recap?
BTC volume is 0.66x and ETH 0.5x their 7-day averages, indicating reduced participation — moves on thin volume are less confirmed and can reverse more easily.


