BTC ETH Daily Recap — 2026-10-12

BTC ETH Daily Recap — 2026-10-12
Today at a Glance
Bitcoin enters the October 12 session trading at $82,977, down 0.95% over 24 hours after a modest pullback from an intraday high of $84,352. The move extends a softer seven-day stretch, with BTC lower by 3.25% week-over-week, though the monthly picture remains constructive at +7.98%. Volume is running at just 0.61x the 7-day average, suggesting the pullback is occurring on thinning participation rather than aggressive distribution.
Ethereum tells a weaker short-term story. ETH trades at $2,542, up a marginal 0.19% in the last 24 hours but down 6.21% over seven days — underperforming BTC by roughly three percentage points on that window. ETH's 30-day change sits at +2.61%, well behind Bitcoin's monthly gain. With ETH's RSI(14) at 33.8, the asset is approaching oversold territory while BTC's RSI holds at a neutral 47.7. Both assets are printing volume below their 7-day averages, with ETH at 0.68x. Notably, ETH remains below both its MA7 ($2,546) and MA30 ($2,617), while BTC is sandwiched between its own moving averages.
Bitcoin Analysis
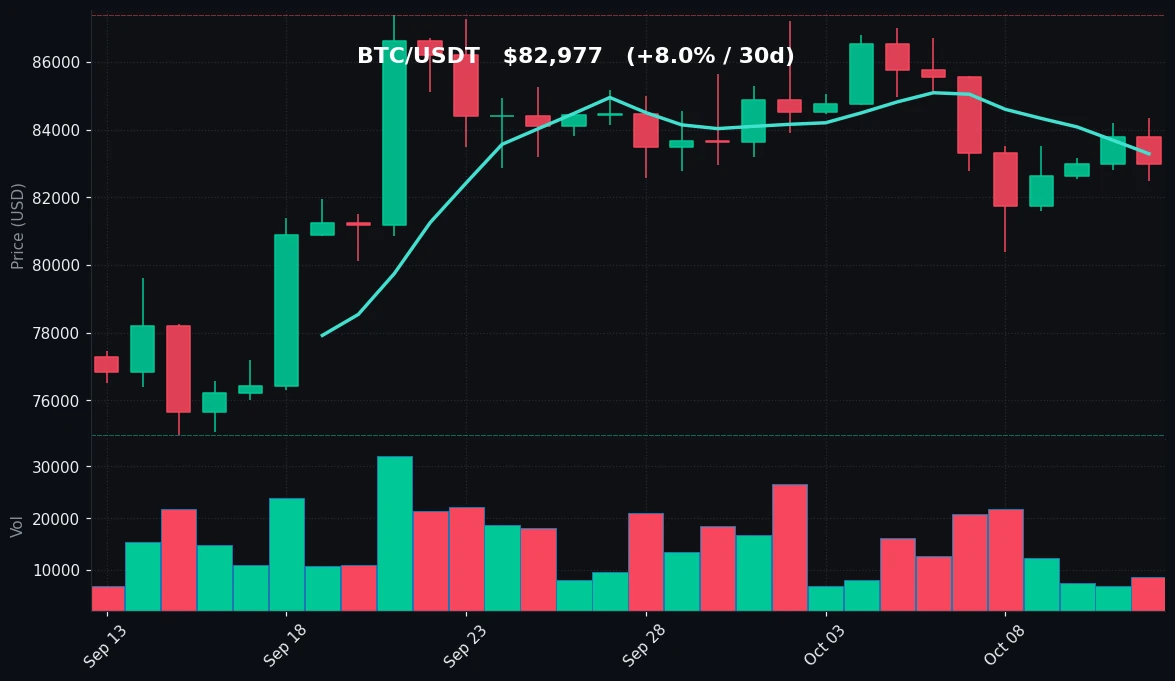
TradingView Live (4h)
Bitcoin's daily structure is best described as a consolidation within a broader uptrend. The 30-day change of +7.98% confirms that the medium-term trend remains positive, with price having recovered from the 30-day low of $74,968 toward the upper end of its monthly range. The 30-day high of $87,396 marks the ceiling of that range, and BTC is currently trading roughly 5% below it.
Zooming into the shorter timeframe, the seven-day picture is corrective. BTC peaked at $86,699 within the past week before sliding to a low of $80,394 — a swing of approximately $6,300, or 7.3% from high to low. The current price of $82,977 sits in the lower-middle portion of that weekly range, having recovered from the $80,394 trough but failing to reclaim the mid-$84,000s.
The moving averages provide the clearest read on positioning. The MA7 sits at $83,286, just $309 above the current price, meaning BTC is trading marginally below its short-term average. The MA30 at $82,716 sits $261 below the current price, meaning BTC remains marginally above its monthly average. This configuration — price pinned between the MA7 above and MA30 below — is characteristic of a market that has lost short-term momentum but has not broken medium-term structure. The gap between the two averages is narrow (roughly $570, or 0.7%), indicating a compressed, indecisive regime.
Momentum is neutral. RSI(14) at 47.7 sits almost exactly at the midpoint of the 30–70 band, neither confirming strength nor signaling exhaustion. This is consistent with a market digesting a prior advance rather than one in the grip of a directional move.
The most notable data point is volume. At 0.61x the 7-day average, participation is materially below normal. Low-volume pullbacks are generally interpreted as less conviction-driven than high-volume declines — sellers are not aggressively pressing. However, low volume also means rallies lack fuel, and it raises the risk of sharp, thin-book moves in either direction.
Key levels to monitor: on the downside, the $82,716 MA30 and the $82,476 24-hour low form a near-term support cluster, with the $80,394 weekly low beneath. On the upside, the $83,286 MA7 is the first hurdle, followed by the $84,352 24-hour high and the $86,699 weekly high.
Ethereum Analysis
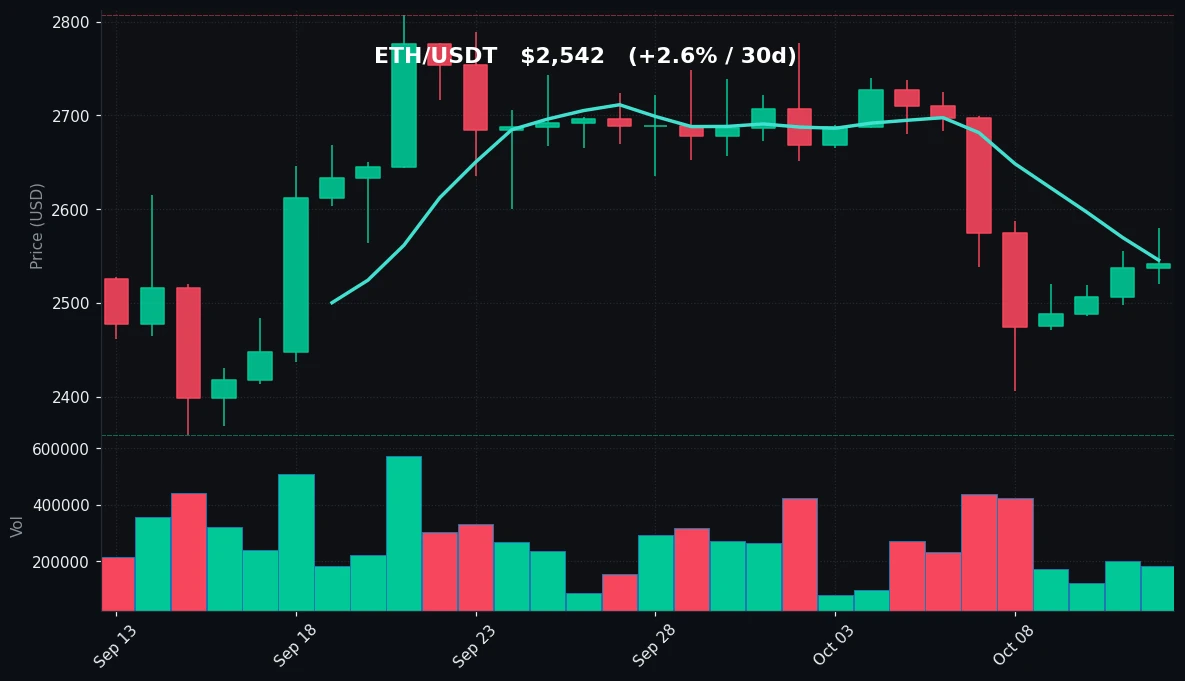
TradingView Live (4h)
Ethereum's setup is distinctly weaker than Bitcoin's on nearly every timeframe. The 24-hour change of +0.19% is essentially flat, but the seven-day decline of 6.21% represents a sharp relative underperformance. ETH's weekly range runs from $2,406 to $2,725 — a swing of roughly $319, or about 13% — and the current price of $2,542 sits in the lower half of that band, only about $136 above the weekly low.
The moving average structure is bearish. ETH trades at $2,542, below both the MA7 at $2,546 and the MA30 at $2,617. Being below the MA30 is particularly significant: it means the monthly average cost basis of market participants is above the current price, a configuration that typically reflects a market still working through overhead supply. The MA7 sitting just $4 above spot indicates price is effectively pinned to its short-term average, with no meaningful short-term momentum in either direction.
Momentum is the standout signal. RSI(14) at 33.8 places ETH close to — but not inside — oversold territory (conventionally defined as below 30). This is the lowest reading of the two assets by a wide margin and reflects sustained selling pressure over the past week. An RSI in the low-to-mid 30s often accompanies the later stages of a pullback, though it is not by itself a reversal signal.
Volume at 0.68x the 7-day average is below normal but slightly firmer than BTC's 0.61x. This suggests the ETH decline has seen marginally more relative participation than BTC's, consistent with the steeper price decline.
The 30-day picture is only mildly positive at +2.61%, and the 30-day range ($2,359 to $2,807) shows ETH has spent the month oscillating in a broad band without establishing a clear directional trend. The 30-day low of $2,359 is roughly 7.2% below the current price, while the 30-day high of $2,807 is about 10.4% above.
Key levels: on the downside, the $2,520 24-hour low is the immediate support, with the $2,406 weekly low and $2,359 monthly low beneath. On the upside, the $2,546 MA7 is the first resistance, followed by the $2,617 MA30 — a cluster that must be reclaimed for the structure to improve — and then the $2,725 weekly high.
Key Technical Levels
| Asset | Support | Resistance | RSI |
|---|---|---|---|
| BTC | $82,716 (MA30) / $82,476 (24h low) / $80,394 (7d low) | $83,286 (MA7) / $84,352 (24h high) / $86,699 (7d high) | 47.7 — neutral |
| ETH | $2,520 (24h low) / $2,406 (7d low) / $2,359 (30d low) | $2,546 (MA7) / $2,617 (MA30) / $2,725 (7d high) | 33.8 — near oversold |
BTC vs ETH Dynamic
The two largest crypto assets are currently moving with a shared directional bias but divergent magnitude. Both are in seven-day drawdowns (BTC -3.25%, ETH -6.21%), both are trading on below-average volume, and both have RSI readings below 50. The correlation in direction is clear, but the divergence in degree is the more informative signal: ETH's decline is roughly 1.9x BTC's on the weekly window, and ETH's RSI is nearly 14 points lower. This kind of spread typically reflects capital rotating toward BTC as the relative safe haven within the asset class during periods of consolidation. BTC's position above its MA30 versus ETH's position below its MA30 reinforces that the market is currently favoring the larger, more liquid asset. Traders watching for a shift in this dynamic would look for ETH to reclaim its MA7 ($2,546) and begin closing the RSI gap.
Strategy Fit
Today's conditions — compressed moving averages, neutral-to-weak RSI readings, and volume at roughly 0.6–0.7x normal — describe a range-bound, low-conviction market rather than a trending one. In such environments, mean-reversion and accumulation approaches tend to fit the observed price behavior better than momentum-following strategies, since neither asset has shown the sustained directional expansion that trend strategies require.
For range-bound conditions, grid strategies are structurally suited: they place layered buy and sell orders around a defined band and profit from oscillation. BTC's tight MA7/MA30 cluster and ETH's broader weekly range both present definable boundaries for grid parameters. For traders with a longer horizon and a constructive view on the 30-day trend, DCA offers a systematic way to accumulate through the current soft patch without attempting to time a bottom. Trend-following approaches would generally require confirmation — such as a volume-backed break above the MA7 and 24-hour highs — before offering a clear signal.
Pionex offers built-in bots that map directly to these conditions, including grid trading bots and DCA bots, alongside futures grid options. Because these tools execute predefined logic, they can help remove emotional decision-making during choppy, low-volume stretches. Strategy selection should always be matched to individual risk tolerance and market conditions, and no single approach is appropriate for all participants.
Risk Disclaimer
This article is for informational purposes only and does not constitute financial, investment, or trading advice. The data and analysis presented reflect market conditions as of 2026-10-12 and are subject to rapid change. Cryptocurrency markets are highly volatile and can result in the total loss of capital. Technical indicators such as RSI, moving averages, and volume ratios are descriptive tools, not predictive guarantees. Past performance is not indicative of future results. Readers should conduct their own research and consult a qualified financial professional before making any investment decisions. The author holds no responsibility for any losses incurred based on the content of this article.
FAQ
What does BTC's RSI of 47.7 indicate?
An RSI of 47.7 is neutral — it sits near the midpoint of the 0–100 scale, indicating neither overbought (above 70) nor oversold (below 30) conditions. It suggests balanced momentum with no strong directional bias at present.
Why is ETH underperforming BTC this week?
ETH is down 6.21% over seven days versus BTC's 3.25%. ETH also trades below both its MA7 and MA30, while BTC holds above its MA30. This pattern is consistent with capital favoring BTC during a consolidation phase.
What are the key support levels for Bitcoin right now?
The nearest supports are the MA30 at $82,716 and the 24-hour low at $82,476. Below those, the seven-day low at $80,394 is the next significant level.
What volume levels are BTC and ETH trading at?
BTC volume is at 0.61x its 7-day average, and ETH is at 0.68x. Both are below normal, indicating reduced market participation during the current pullback.
What strategy types suit a low-volume, range-bound market?
Range-bound conditions with compressed moving averages and neutral RSI often suit grid and DCA approaches, which are designed for oscillation and systematic accumulation rather than directional momentum. Pionex offers built-in grid and DCA bots that align with these conditions.


