BTC ETH Daily Recap — 2026-10-09

BTC ETH Daily Recap — 2026-10-09
Today at a Glance
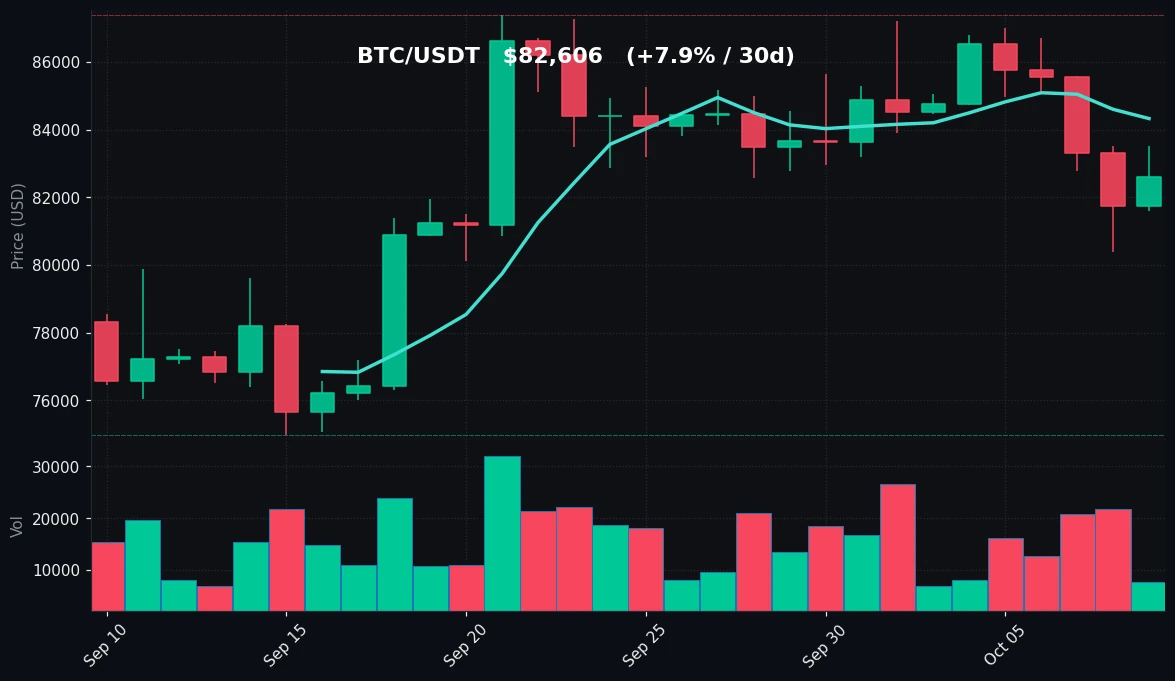
Bitcoin is trading at $82,606, up +1.04% over the past 24 hours, with an intraday range of $81,604 to $83,529. On a weekly basis, BTC remains down -2.26%, though it holds a +7.88% gain over 30 days. The 7-day high of $86,999 versus the low of $80,394 shows a $6,605 weekly range, and price is currently sitting below the 7-day moving average of $84,326 but above the 30-day MA of $82,093. RSI(14) at 43.1 puts momentum in neutral-to-soft territory, and volume is running at just 0.47x the 7-day average — a notably quiet tape.
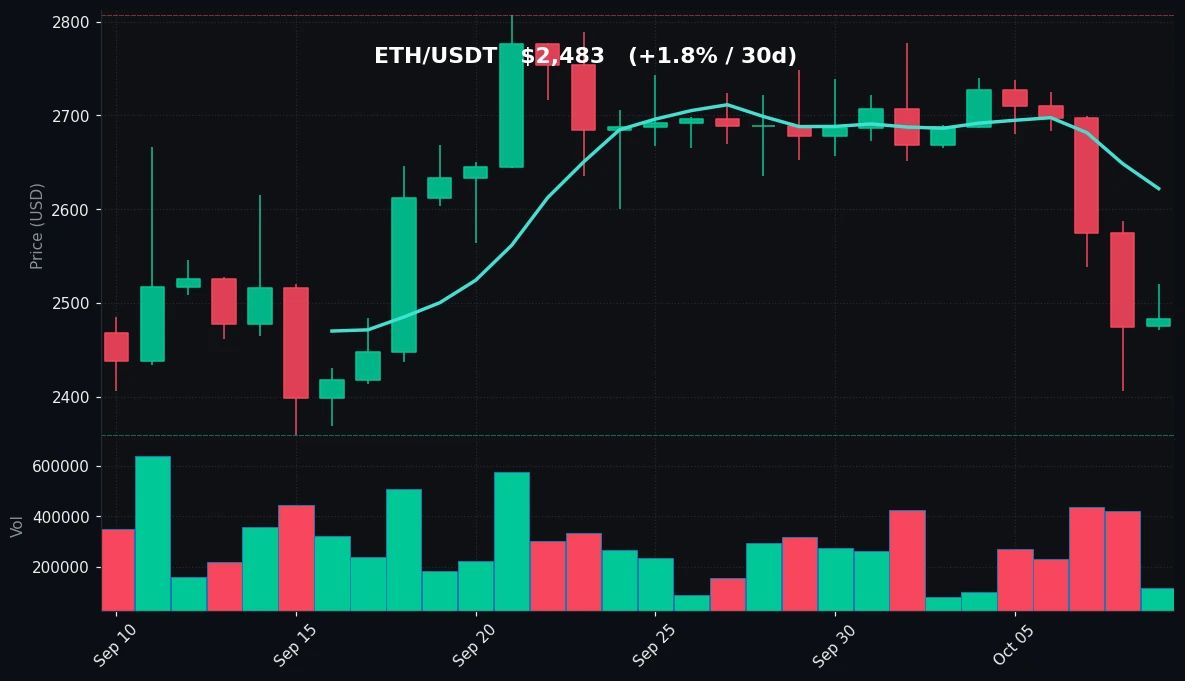
Ethereum is at $2,483, up +0.32% in 24 hours, but the weekly picture is materially weaker: -6.97% over 7 days and only +1.82% over 30 days. ETH's RSI(14) has fallen to 24.4, deep in oversold territory, while volume sits at 0.42x the 7-day average. ETH is trading below both its MA7 ($2,622) and MA30 ($2,613).
Bitcoin Analysis
TradingView Live (4h)
Bitcoin's structure on the daily timeframe shows a market that has pulled back from a monthly high of $87,396 and is now consolidating in the low-$80,000s. The 30-day range spans $74,968 to $87,396 — a $12,428 band — and the current price of $82,606 sits roughly in the middle of that range, slightly above the 30-day midpoint of approximately $81,182. That positioning matters: it suggests neither a decisive breakout nor a breakdown, but rather a coiling phase after an extended move higher.
The moving average configuration is the key technical tell right now. BTC's MA7 at $84,326 is above the MA30 at $82,093, and spot price at $82,606 is sandwiched between the two. This is a compressed setup — the gap between the two averages is only about $2,233, or roughly 2.7% of spot. When the 7-day and 30-day averages converge this tightly, it typically reflects a market that has absorbed a directional move and is now waiting for a catalyst. The fact that price is below the faster MA7 tells us short-term momentum has cooled, while holding above the slower MA30 keeps the medium-term trend intact.
On the downside, the first level to watch is the 30-day MA at $82,093, which is essentially coincident with spot. A clean break below that would open the door to the 7-day low at $80,394, and beneath that, the 30-day low at $74,968. On the upside, the 7-day high at $86,999 is the immediate ceiling, with the 30-day high at $87,396 just above it — a tight cluster of resistance that has already rejected price once this month.
RSI(14) at 43.1 is neutral but leaning toward the weaker side of the range. It's not oversold — that would require a print below 30 — but it's also not showing the kind of momentum that typically accompanies a fresh leg higher. What's more telling is the volume picture: 0.47x the 7-day average. In a week where BTC ranged from $80,394 to $86,999, that's a striking lack of participation. Low-volume pullbacks within an uptrend are often characterized as constructive, but low-volume consolidation near the middle of a range is more ambiguous — it signals indecision rather than conviction in either direction.
The 24-hour range itself was narrow: $81,604 to $83,529, a spread of just $1,925, or about 2.3%. For Bitcoin, that's a tight session. Combined with the subdued volume and mid-range RSI, the tape reads as a market in wait-and-see mode.
Ethereum Analysis
TradingView Live (4h)
Ethereum's chart is telling a more stressed story than Bitcoin's. At $2,483, ETH is down -6.97% over 7 days and has fallen well below both of its key moving averages — MA7 at $2,622 and MA30 at $2,613. That's a bearish alignment: price below both averages, with the two averages themselves nearly converged (a $9 gap). When spot trades below a flat, converged MA pair, it signals that the recent trend has lost its footing and sellers have taken short-term control.
The 30-day range for ETH is $2,359 to $2,807 — a $448 band. Spot at $2,483 sits in the lower-middle portion of that range, about 55% up from the 30-day low. The 7-day range is wider in percentage terms than BTC's: $2,406 to $2,740, a $334 spread, or roughly 13.5% of spot. That's a volatile week for ETH, and the direction of that volatility has been down.
The most striking data point on the entire dashboard is ETH's RSI(14) at 24.4. That is firmly in oversold territory — below the 30 threshold that technicians typically use to flag exhaustion of selling pressure. It's worth being precise about what this does and doesn't mean. Oversold conditions describe the speed and magnitude of a decline, not a guaranteed reversal. ETH can remain oversold for extended periods, and in strong downtrends, RSI prints in the 20s are not uncommon. But it does tell us that the recent selling has been aggressive and one-sided.
Volume reinforces the cautious read: 0.42x the 7-day average. Here's the nuance — a sharp decline on below-average volume can mean two things. Either sellers are exhausting themselves and the move lacks the participation to continue, or buyers are simply absent and the market is drifting lower on light flow. The distinction matters, and the current data doesn't resolve it definitively.
Key levels for ETH: the immediate support zone is the 7-day low at $2,406, with the 30-day low at $2,359 beneath it. Resistance begins at the MA30/MA7 cluster around $2,613–$2,622, then the 7-day high at $2,740, and finally the 30-day high at $2,807. The 24-hour range was narrow — $2,471 to $2,521 — suggesting the selloff paused today even as the weekly trend remains negative.
Key Technical Levels
| Asset | Support | Resistance | RSI |
|---|---|---|---|
| BTC | $82,093 (MA30) / $80,394 (7d low) | $84,326 (MA7) / $86,999 (7d high) | 43.1 — neutral |
| ETH | $2,406 (7d low) / $2,359 (30d low) | $2,613 (MA30) / $2,740 (7d high) | 24.4 — oversold |
BTC vs ETH Dynamic
The divergence between the two majors is the defining feature of today's tape. BTC is down -2.26% on the week; ETH is down -6.97% — roughly three times the drawdown. BTC holds a +7.88% 30-day gain while ETH has managed only +1.82%. BTC's RSI at 43.1 is neutral; ETH's at 24.4 is oversold. BTC is trading above its 30-day moving average; ETH is below both its 7-day and 30-day averages. In practice, this means capital within the large-cap crypto complex has been rotating toward Bitcoin and away from Ethereum — a defensive posture. ETH's beta to BTC has worked against it on the downside this week, and until ETH reclaims its MA cluster near $2,613–$2,622, the relative-strength gap is likely to persist. Correlation between the two remains high in direction, but the magnitude asymmetry is what traders are pricing.
Strategy Fit
Today's conditions — compressed moving averages on BTC, oversold RSI on ETH, and volume at roughly 0.4–0.5x the 7-day average across both — point to a range-bound, low-conviction environment rather than a clean trending one. In such regimes, mean-reversion and accumulation approaches tend to fit better than momentum-following strategies, because breakouts on thin volume have a higher tendency to fail.
For BTC, the tight $82,093–$84,326 band between the MA30 and MA7 is a natural grid zone: range-bound price action with defined boundaries is the textbook setup for grid trading, which places layered buy and sell orders to capture oscillation. For ETH, the oversold RSI at 24.4 combined with a defined support shelf at $2,406–$2,359 makes a case for systematic DCA — spreading entries over time rather than trying to catch a single bottom — while a grid could be positioned between support and the $2,613 MA30 resistance. Trend-following strategies have less to work with today given the lack of volume confirmation.
Pionex offers built-in bots that map directly to these conditions: its Grid Trading Bot for range-bound BTC, its DCA Bot for staggered ETH accumulation, and its Rebalancing Bot for traders who want to maintain target allocations across both assets through the divergence. These are execution tools, not signals — the market read above should drive whether any of them suit your own risk profile.
Risk Disclaimer
This article is for informational purposes only and does not constitute financial, investment, or trading advice. Cryptocurrency markets are highly volatile and can result in the total loss of capital. Technical indicators such as RSI, moving averages, and volume ratios describe past price behavior and do not predict future outcomes. Nothing here should be interpreted as a recommendation to buy, sell, or hold any asset. Always conduct your own research and consult a licensed financial advisor before making investment decisions.
FAQ
What does BTC's RSI of 43.1 indicate?
An RSI(14) of 43.1 is in neutral territory — above the oversold threshold of 30 and below the overbought threshold of 70. It suggests momentum has cooled from recent highs but that neither buyers nor sellers have decisive control.
Why is ETH's RSI at 24.4 significant?
Readings below 30 are classified as oversold, meaning the recent decline has been sharp and sustained. It signals stretched selling pressure, but oversold conditions can persist in downtrends and do not guarantee a reversal.
What are the key levels to watch for Bitcoin?
Support sits at the 30-day MA of $82,093 and the 7-day low of $80,394. Resistance is at the 7-day MA of $84,326 and the 7-day high of $86,999, with the 30-day high at $87,396 just above.
Why is ETH underperforming BTC this week?
ETH is down -6.97% over 7 days versus BTC's -2.26%, and it trades below both its MA7 and MA30 while BTC holds above its MA30. This indicates capital rotating toward Bitcoin within the large-cap complex.
What strategy types suit low-volume, range-bound conditions?
Grid strategies are commonly associated with range-bound markets, while DCA suits staggered accumulation during weakness. Pionex provides built-in bots for both approaches, though strategy selection should always match individual risk tolerance.


