BTC ETH Daily Recap — 2026-10-05

BTC ETH Daily Recap — 2026-10-05
Today at a Glance
Bitcoin enters the new trading week essentially flat over the past 24 hours, printing $86,430 for a marginal -0.12% daily change. The session was compressed, with a high of $86,999 and a low of $85,412 framing a roughly $1,600 intraday range. Despite the quiet daily candle, the broader picture remains constructive: BTC is +3.51% on the week and +7.58% on the month, holding comfortably above both its 7-day moving average ($84,914) and 30-day moving average ($81,548). Momentum has cooled, however, with RSI(14) at 48.8 — neutral territory — and volume running at just 0.61x the 7-day average.
Ethereum is similarly subdued, trading at $2,722 for -0.19% on the day, within a tight $2,695–$2,738 band. ETH is +1.23% over seven days and +8.25% over 30 days, still above its MA7 ($2,696) and MA30 ($2,604). Notably, ETH's RSI(14) sits at 39.2 — the weaker of the two — while volume is only 0.5x the 7-day average. Both assets are consolidating near range highs on thinning participation.
Bitcoin Analysis
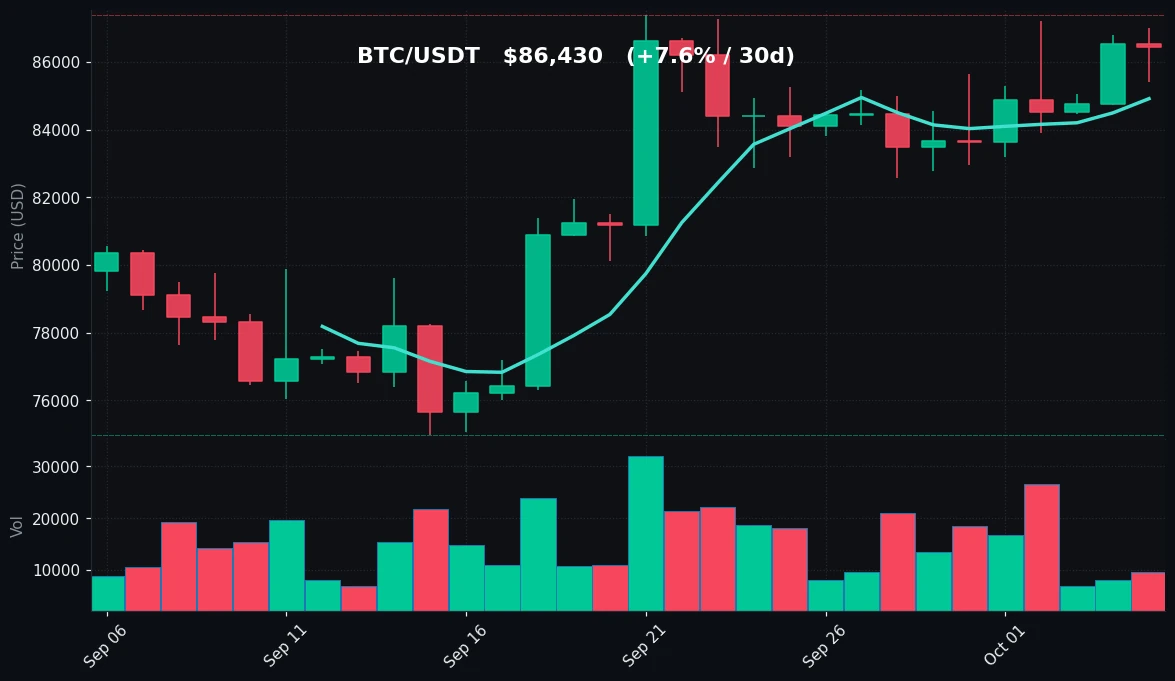
TradingView Live (4h)
Bitcoin's daily structure remains one of higher lows and higher highs on the intermediate timeframe. From the 30-day low of $74,968, price has advanced to the current $86,430 area, a move of roughly 15%, and the 30-day high of $87,396 sits only about 1.1% above spot. That proximity to the monthly peak is the defining feature of the current setup: BTC is consolidating in the upper quartile of its 30-day range rather than pulling back toward the middle or lower boundary.
The moving average configuration supports the constructive read. MA7 at $84,914 and MA30 at $81,548 are both below the current price, and MA7 sits above MA30 — a bullish ordering that has persisted through the recent advance. The gap between spot and MA7 is approximately $1,516, or 1.75%, which is a modest extension rather than a stretched one. The gap to MA30 is larger at roughly $4,882, or 5.7%, reflecting the strength of the past month's trend. For trend-following frameworks, the relevant observation is that price has not yet tested MA7 on a closing basis during this leg.
On the 7-day view, the range spans from $82,776 to $87,220 — a width of about $4,444, or roughly 5.4% of spot. The current price sits in the upper portion of that band, about $790 below the 7-day high. Intraday, the $85,412 low marks the nearest reference point from the most recent session, while $86,999 is the immediate ceiling established today.
Momentum is the notable divergence. RSI(14) at 48.8 is almost exactly mid-range — neither overbought nor oversold — and represents a meaningful cooling from what would typically accompany a push into 30-day highs. This suggests the recent advance has been absorbed without a momentum surge, consistent with the volume data: 0.61x the 7-day average indicates participation well below the recent norm. Thin volume during consolidation near highs can reflect either lack of selling pressure or lack of fresh demand; the data alone does not distinguish between the two.
Key technical reference points for BTC: immediate support aligns with the MA7 at $84,914, followed by the 7-day low at $82,776 and the MA30 at $81,548. To the upside, resistance is defined by today's high at $86,999, the 7-day high at $87,220, and the 30-day high at $87,396 — a cluster of three levels within roughly $400 of each other. That clustering makes the $87,000–$87,400 zone the most technically significant overhead band on the chart.
Ethereum Analysis
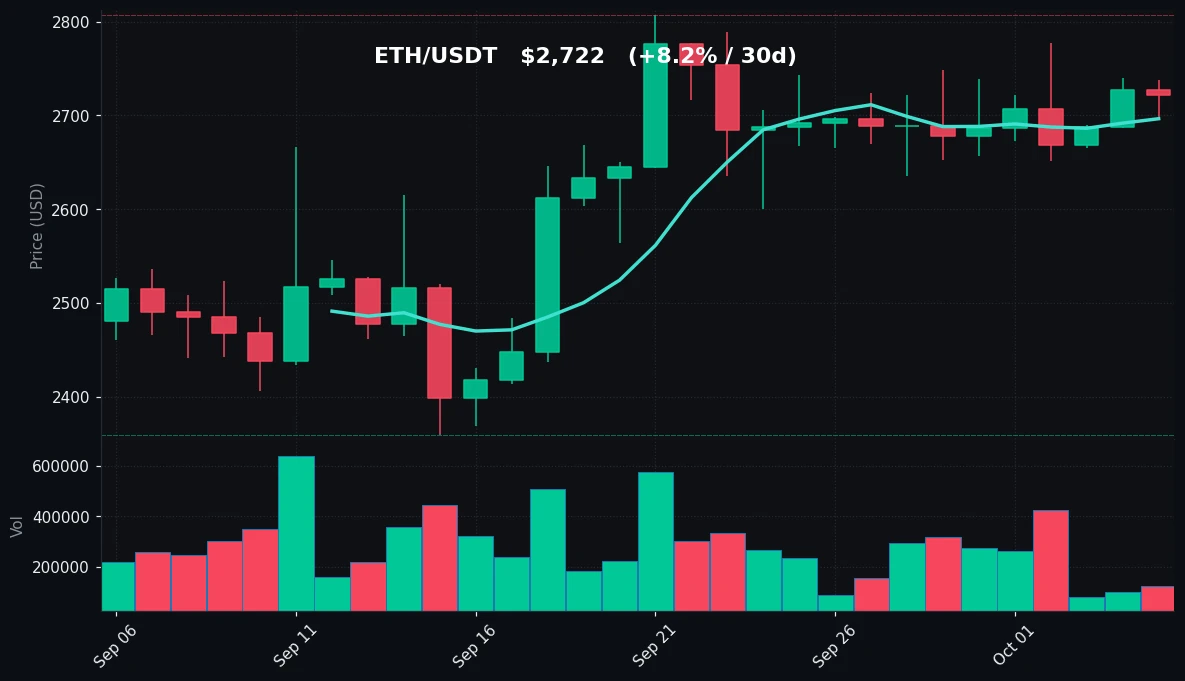
TradingView Live (4h)
Ethereum's structure is comparable to Bitcoin's but with a visibly weaker momentum profile. Price at $2,722 is above both MA7 ($2,696) and MA30 ($2,604), preserving the bullish moving-average ordering, but the margin above MA7 is only about $26, or just under 1%. That is a far tighter cushion than BTC's 1.75% gap, implying ETH is closer to a potential test of its short-term average.
The 30-day range runs from $2,359 to $2,807, a width of roughly 19% of the current price — wider in percentage terms than BTC's 30-day range. ETH's +8.25% 30-day gain has carried it to within about 3.1% of the 30-day high, whereas BTC is within roughly 1.1% of its equivalent level. In other words, ETH has recovered strongly over the month but has not pressed as close to its monthly peak as BTC has to its own.
On the 7-day timeframe, ETH's range is $2,651 to $2,777, a band of about $126, or 4.6% of spot. The current price sits in the middle-upper region, roughly $55 below the 7-day high and $71 above the 7-day low. Today's session was particularly compressed: a high of $2,738 and a low of $2,695, a range of just $43, or about 1.6% — narrower than BTC's intraday band in percentage terms.
The standout data point is RSI(14) at 39.2. This is below the neutral 50 line and approaching — though not reaching — oversold territory. For an asset that is up 8.25% over 30 days and holding above both key moving averages, a sub-40 RSI indicates that recent price gains have not been matched by momentum expansion. Combined with volume at 0.5x the 7-day average — the lowest participation reading in this dataset — ETH's consolidation is occurring on notably light flow.
Key technical reference points for ETH: support is anchored at the MA7 ($2,696), which is immediately beneath spot and coincides closely with today's low of $2,695 — a confluence that makes the $2,695–$2,696 zone the first line to watch. Below that, the 7-day low at $2,651 and the MA30 at $2,604 provide subsequent references. Resistance begins at today's high of $2,738, followed by the 7-day high at $2,777 and the 30-day high at $2,807.
Key Technical Levels
| Asset | Support | Resistance | RSI |
|---|---|---|---|
| BTC | $84,914 (MA7) / $82,776 (7d low) | $86,999 (24h high) / $87,396 (30d high) | 48.8 — neutral |
| ETH | $2,696 (MA7) / $2,651 (7d low) | $2,738 (24h high) / $2,807 (30d high) | 39.2 — neutral, near oversold |
BTC vs ETH Dynamic
BTC and ETH are moving in close lockstep on the daily timeframe, with both printing near-identical 24-hour changes (-0.12% and -0.19%) and both consolidating in the upper portion of their respective ranges. The divergence appears in the momentum and participation data rather than in price direction: BTC's RSI at 48.8 is meaningfully higher than ETH's 39.2, and BTC's relative volume (0.61x) exceeds ETH's (0.5x). Over the 30-day window, ETH has actually outperformed on price (+8.25% vs +7.58%), yet its momentum reading is weaker — a configuration that suggests ETH's gains were more front-loaded within the period while BTC's advance has been more recent. Both assets show volume below their 7-day averages, indicating the correlation is currently being expressed through shared low-conviction consolidation rather than through a directional lead from either one.
Strategy Fit
Today's data describes a low-volatility, low-volume consolidation regime. BTC's intraday range was about 1.8% of spot and ETH's about 1.6%, both narrow by recent standards. Volume at 0.61x and 0.5x the 7-day averages confirms that participation is thin. Range-bound conditions with compressed volatility and defined boundaries — BTC between roughly $84,900 and $87,400, ETH between roughly $2,650 and $2,810 — are the environment in which grid strategies are typically considered, since grids seek to capture repeated oscillation within a range rather than directional moves. DCA-style accumulation frameworks are also relevant when price is holding above key moving averages on light flow, as they do not depend on immediate momentum. Trend-following approaches, by contrast, generally require expanding volume and momentum confirmation, neither of which is present in today's readings. Pionex offers built-in bots — including grid trading and DCA bots — that automate these strategy types, allowing parameters to be set around the technical levels identified above. Strategy selection should always match the user's own risk tolerance and market view.
Risk Disclaimer
This market recap is provided for informational purposes only and does not constitute financial, investment, or trading advice. The data and technical levels discussed reflect past and current market conditions, which may change rapidly. Cryptocurrency markets are highly volatile and carry substantial risk of loss. Nothing in this document should be interpreted as a recommendation to buy, sell, or hold any asset, or to deploy any particular strategy. Readers should conduct their own research and consult a qualified financial professional before making any investment decisions.
FAQ
What was Bitcoin's price on 2026-10-05?
BTC/USDT traded at $86,430, down 0.12% over 24 hours, with an intraday high of $86,999 and low of $85,412.
How did Ethereum perform compared to Bitcoin today?
Both were nearly flat: ETH at $2,722 (-0.19%) versus BTC at $86,430 (-0.12%). ETH's RSI (39.2) was lower than BTC's (48.8), and ETH's relative volume (0.5x) was lighter than BTC's (0.61x).
What are the key resistance levels for BTC and ETH?
For BTC, resistance sits at $86,999 (24h high), $87,220 (7d high), and $87,396 (30d high). For ETH, resistance is at $2,738 (24h high), $2,777 (7d high), and $2,807 (30d high).
Are BTC and ETH overbought or oversold?
Neither. BTC's RSI(14) of 48.8 is neutral, and ETH's 39.2 is neutral but closer to oversold territory. Neither asset shows overbought conditions.
What do the low volume readings indicate?
BTC volume was 0.61x its 7-day average and ETH was 0.5x, indicating below-average participation. Low volume during consolidation near range highs reflects a lack of conviction in either direction based on the data alone.


