BTC ETH Daily Recap — 2026-10-25

BTC ETH Daily Recap — 2026-10-25
Today at a Glance
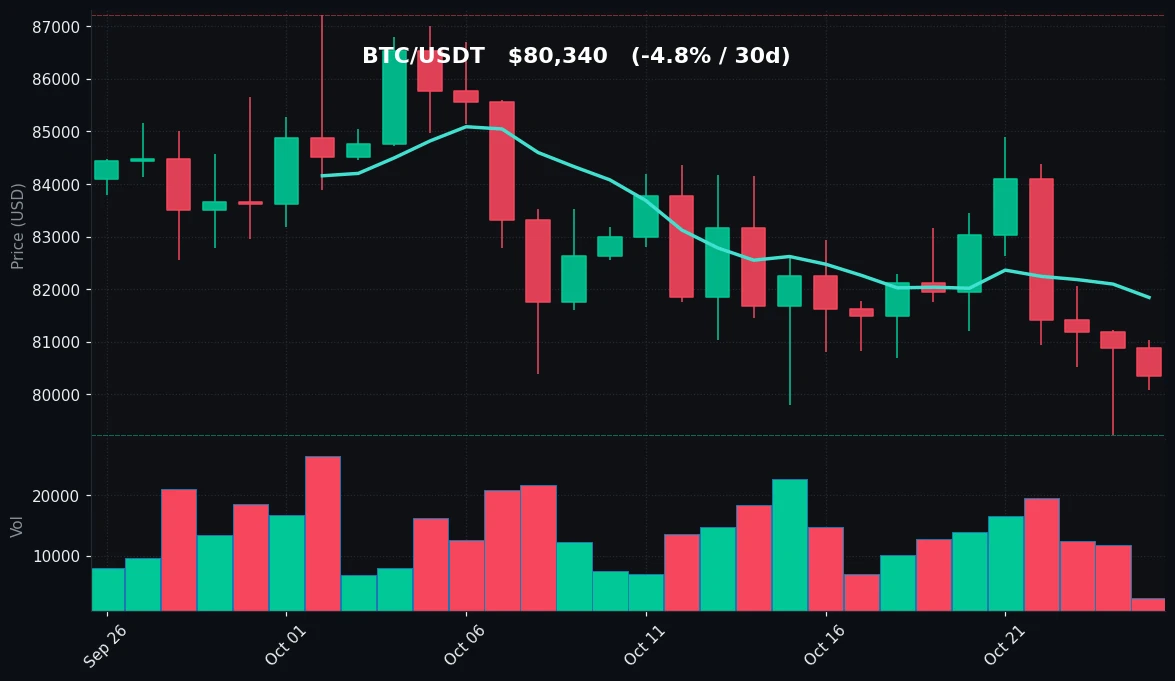
Bitcoin is trading at $80,340, down 0.68% over the past 24 hours, with an intraday range of $81,034 to $80,088. The move extends a softer weekly trend: BTC is down 2.16% on the 7-day and 4.85% on the 30-day, and it now sits below both its 7-day moving average ($81,842) and 30-day moving average ($83,108). RSI(14) at 36.5 places momentum in the lower-neutral zone, while volume at 0.22x the 7-day average signals thin participation.
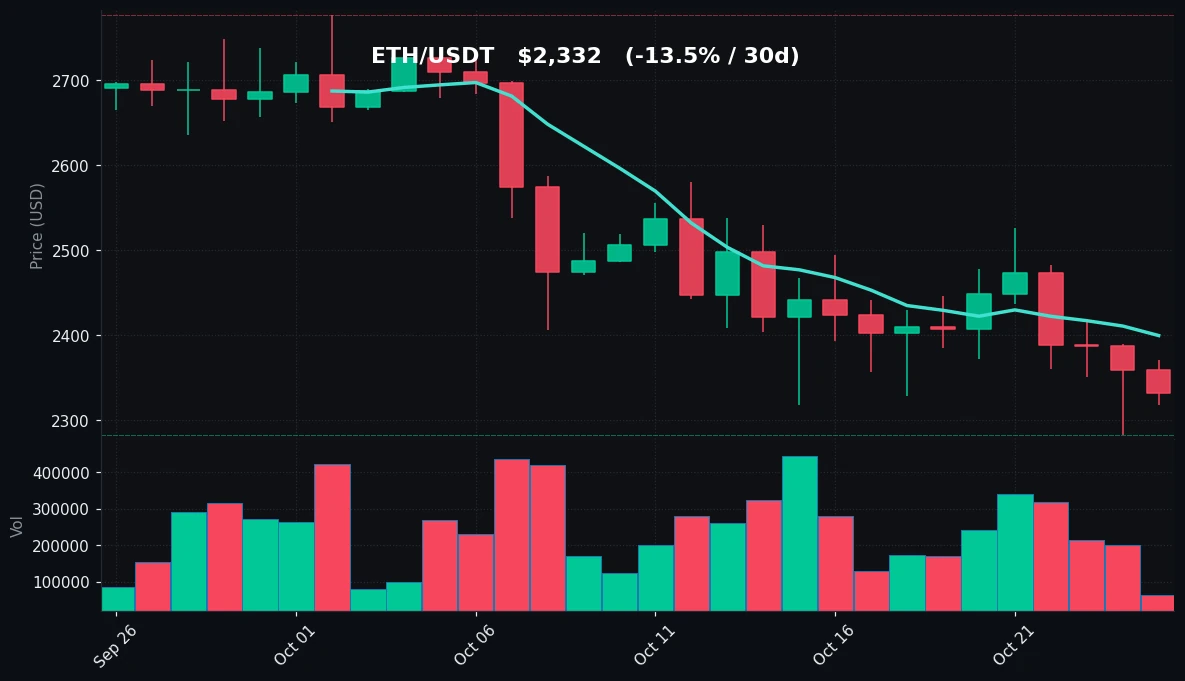
Ethereum is at $2,332, down 1.14% on the day within a $2,318–$2,372 range. ETH's relative weakness is more pronounced over longer horizons: -3.25% on the week and -13.51% on the month. With RSI(14) at 29.3, ETH is now in oversold territory, trading well below its MA7 ($2,400) and MA30 ($2,535). Volume at 0.27x the 7-day average is similarly subdued.
Bitcoin Analysis
TradingView Live (4h)
BTC's trend structure remains tilted to the downside across the timeframes visible in today's data. Price at $80,340 is below both the MA7 ($81,842) and MA30 ($83,108), and the moving averages themselves are stacked in bearish order — the shorter MA beneath the longer one — which is characteristic of a market still working through a corrective phase rather than a fresh uptrend. The 30-day range runs from a high of $87,220 down to a low of $79,221, meaning current price is sitting in the lower portion of that band, roughly $1,100 above the monthly floor.
On key technical levels, the immediate support zone is the $79,221 area — the confluence of the 7-day and 30-day lows, and the level that has capped the recent downside. A hold above it keeps the range intact; a decisive break would mark a fresh monthly low and shift the structure. To the upside, resistance layers begin at the MA7 near $81,842, followed by the MA30 around $83,108. The 7-day high of $84,898 sits above both, and the 30-day high of $87,220 is the more distant ceiling. Today's high of $81,034 failed to reach even the MA7, underscoring how compressed the intraday action has been.
Volume is the notable tell in this session. At 0.22x the 7-day average, participation is exceptionally light — roughly one-fifth of the recent norm. Low-volume drift lower is generally read as a lack of conviction from either side rather than aggressive distribution, but it also means price can move on relatively small flows, and it offers little confirmation of directional intent. Thin conditions around a monthly low warrant attention to how volume behaves on any test of $79,221.
Momentum, as measured by RSI(14) at 36.5, is in the lower-neutral band — weak, but not yet at the oversold threshold typically associated with capitulation-style readings. That leaves room for further drift without the technical condition of exhaustion. Taken together, the picture is one of a market consolidating near the bottom of its monthly range on fading volume, with defined levels above and below framing the structure. No directional conclusion is implied by these observations; they describe the current technical state only.
Ethereum Analysis
TradingView Live (4h)
ETH's technical picture is weaker than BTC's on both trend and momentum measures. At $2,332, price is well below the MA7 ($2,400) and MA30 ($2,535), with the same bearish MA stacking evident. The 30-day decline of 13.51% is nearly three times BTC's 4.85% drawdown over the same window, and the 30-day range — $2,777 high to $2,282 low — places current price within about $50 of the monthly floor. That proximity to the low is the most consequential feature of today's setup.
Support is concentrated at $2,282, the 30-day and 7-day low. Today's session low of $2,318 held above it, but only narrowly, and the 7-day high of $2,527 shows how far price has traveled from the upper end of the recent range. On the resistance side, the MA7 at $2,400 is the first hurdle, followed by the MA30 at $2,535 and the 30-day high at $2,777. Today's high of $2,372 also failed to reach the MA7, mirroring BTC's pattern of capped intraday rallies.
The RSI(14) reading of 29.3 is the headline technical event: ETH has crossed into oversold territory. This is a momentum condition, not a signal — oversold readings can persist and can deepen during sustained declines — but it distinguishes ETH from BTC (36.5) and marks a divergence in relative momentum. Volume at 0.27x the 7-day average is similarly light, slightly above BTC's ratio but still far below normal. As with BTC, the low-volume environment reduces the informational value of the price drift and raises the sensitivity of any larger flow.
Structurally, ETH is testing the lower boundary of its monthly range with momentum in oversold territory and volume depleted. The levels that matter are clear: $2,282 below, $2,400 and $2,535 above. The relative underperformance versus BTC over 7 and 30 days is the defining characteristic of this session's ETH data, and the oversold RSI is the distinguishing technical marker. These are descriptive observations of the current state, not forecasts of direction.
Key Technical Levels
| Asset | Support | Resistance | RSI |
|---|---|---|---|
| BTC | $79,221 | $81,842 (MA7) / $83,108 (MA30) | 36.5 — neutral (lower band) |
| ETH | $2,282 | $2,400 (MA7) / $2,535 (MA30) | 29.3 — oversold |
BTC vs ETH Dynamic
The two majors are moving in the same direction but at different magnitudes, a pattern consistent with a risk-off tilt within crypto rather than an idiosyncratic ETH event. Both are below their MA7 and MA30, both posted modest daily declines (BTC -0.68%, ETH -1.14%), and both are trading on heavily reduced volume (0.22x and 0.27x respectively). The divergence shows up in the longer windows: ETH's 30-day drawdown of 13.51% versus BTC's 4.85% indicates beta-driven underperformance, where the higher-volatility asset absorbs more of the downside. The RSI spread — 36.5 for BTC against 29.3 for ETH — reinforces that ETH is further along the momentum spectrum, now oversold while BTC remains lower-neutral. In practice, this means the pair is correlated in direction but not in degree, and ETH's proximity to its monthly low ($2,282, about 2.1% below spot) is tighter than BTC's distance to $79,221 (about 1.4% below spot), leaving both assets near range floors with ETH carrying the weaker momentum profile.
Strategy Fit
Today's conditions — compressed ranges, volume at roughly a fifth to a quarter of the 7-day average, and both assets near monthly lows — favor approaches that are designed for range-bound, low-conviction tape rather than directional exposure. Grid strategies, which profit from oscillation within a defined band, are structurally suited to this kind of environment, though the proximity to support levels means grid boundaries should be set with the $79,221 (BTC) and $2,282 (ETH) floors in mind. DCA-style accumulation is a common fit for oversold readings such as ETH's 29.3 RSI, allowing staged entries rather than single-point exposure. Trend-following strategies are less naturally aligned today given the absence of volume confirmation and the lower-neutral-to-oversold momentum readings. Pionex offers built-in bots — including grid trading and DCA bots — that automate these approaches, and its futures grid is available for users seeking range exposure with leverage, which carries correspondingly elevated risk. Strategy selection should match individual risk tolerance and time horizon; none of the above constitutes a recommendation.
Risk Disclaimer
This recap is provided for informational and educational purposes only and does not constitute financial, investment, or trading advice. Nothing herein is a recommendation to buy, sell, or hold any asset. Cryptocurrency markets are highly volatile and can result in the total loss of capital; leveraged products amplify both gains and losses. Past performance and technical indicators are not reliable predictors of future results. Readers should conduct independent research and consult a qualified professional before making any financial decision.
FAQ
What is BTC trading at on 2026-10-25?
BTC is at $80,340, down 0.68% over 24 hours, with a daily range of $81,034 to $80,088.
Is ETH oversold right now?
Yes — ETH's RSI(14) is 29.3, which places it in oversold territory. BTC's RSI is 36.5, in the lower-neutral band.
Where are the key support levels?
BTC support sits at $79,221 (the 7-day and 30-day low); ETH support is at $2,282 (the 7-day and 30-day low).
How does today's volume compare to normal?
Volume is well below average: 0.22x the 7-day average for BTC and 0.27x for ETH.
Which asset is weaker over 30 days?
ETH, with a 30-day decline of 13.51% versus BTC's 4.85%.


