BTC ETH Daily Recap — 2026-10-13

BTC ETH Daily Recap — 2026-10-13
Today at a Glance
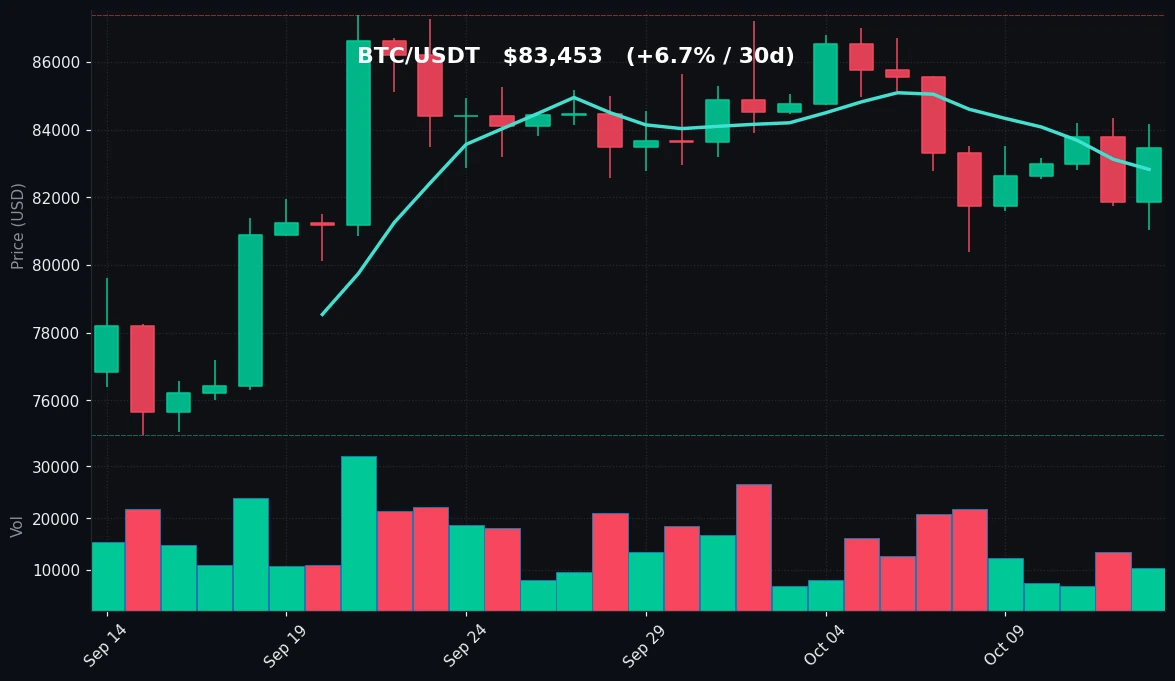
Bitcoin closed the day at $83,453, up 1.96% over 24 hours after trading between $81,034 and $84,168. Despite the green daily candle, BTC remains down 2.45% on the week, though it still holds a 6.73% gain over 30 days. Price is now trading almost exactly on top of its 7-day ($82,825) and 30-day ($82,899) moving averages — a compression zone that suggests the market is searching for direction. RSI(14) at 49.2 is squarely neutral, and volume at 0.76x the 7-day average confirms participation is thin.
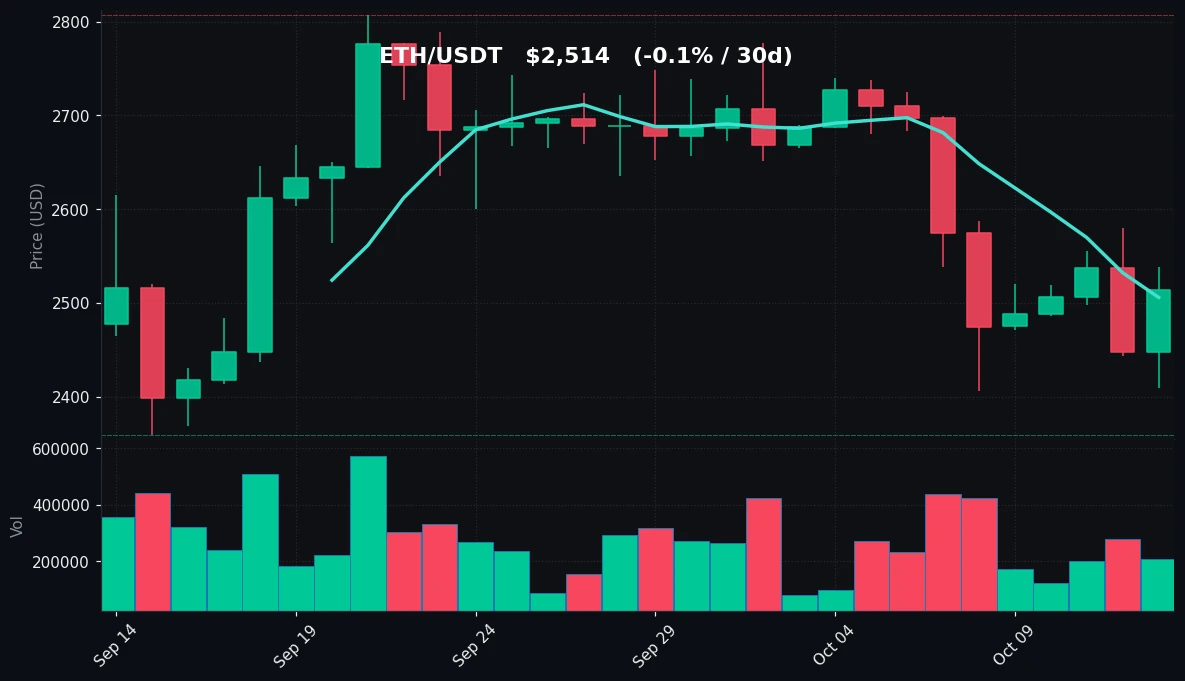
Ethereum outperformed on the day, rising 2.72% to $2,514, but the broader picture is weaker: ETH is down 6.81% over seven days and flat over 30 days (-0.08%). ETH trades below its 30-day MA of $2,615, with RSI at 36.2 — approaching oversold territory. Volume is also light at 0.78x the weekly average.
Bitcoin Analysis
TradingView Live (4h)
Bitcoin's daily structure on 2026-10-13 shows a market in consolidation rather than trend. The 24-hour range of $81,034 to $84,168 represents roughly a 3.9% swing, and the close at $83,453 sits in the upper portion of that band — a modestly constructive sign after several sessions of sideways-to-lower price action. The weekly change of -2.45% tells the more important story: BTC gave back ground over the past seven days, with the 7-day high of $85,598 marking the ceiling of the recent range and the 7-day low of $80,394 marking the floor.
The most notable technical feature is the convergence of the moving averages. The MA7 at $82,825 and MA30 at $82,899 are effectively identical — a spread of just $74, or under 0.1% of price. When short- and medium-term averages flatten into each other, it typically reflects a market that has absorbed the prior move and is now equilibrating. Price at $83,453 is trading marginally above both, which keeps the immediate bias neutral-to-slightly-positive, but there is no decisive separation that would confirm a directional trend.
Zooming out to the 30-day window puts the current pause in context. BTC's 30-day range spans $74,968 to $87,396 — a spread of roughly $12,428, or about 16.6% of the low. The +6.73% 30-day return means the market is still in profit-taking territory relative to a month ago, and the current price sits in the upper-middle of that monthly range. The 30-day high of $87,396 is now about 4.7% above spot, and that level stands as the key resistance that would need to be reclaimed to re-establish an uptrend.
Momentum is neutral by the numbers. RSI(14) at 49.2 is almost perfectly mid-range — neither overbought nor oversold, and with no divergence signal implied by the reading itself. This is consistent with the moving-average compression: momentum has neither confirmed a breakout nor signaled exhaustion.
Volume is the caution flag. At 0.76x the 7-day average, participation is meaningfully below normal. Low-volume advances are less reliable than high-volume ones, and the 1.96% daily gain occurred on contracting activity. That does not invalidate the move, but it argues against reading too much into it. In practical terms, the market is thin, ranges are defined, and neither buyers nor sellers have committed size.
Key levels to monitor: on the downside, the 7-day low at $80,394 is the first structural support, with the 30-day low at $74,968 as the deeper floor. On the upside, the 7-day high at $85,598 is the immediate hurdle, followed by the 30-day high at $87,396.
Ethereum Analysis
TradingView Live (4h)
Ethereum's session on 2026-10-13 was stronger than Bitcoin's in percentage terms — +2.72% to $2,514 — but the underlying structure is noticeably weaker. The 24-hour range of $2,409 to $2,539 shows a bounce off the lows, yet ETH remains down 6.81% over seven days, a materially worse weekly performance than BTC's -2.45%. Over 30 days, ETH is essentially flat at -0.08%, meaning the entire month has been a round trip.
The moving-average picture is decisively bearish relative to BTC's. ETH's MA7 sits at $2,506, just below spot at $2,514, but the MA30 at $2,615 is $101 above the current price — roughly 4% overhead. That gap means the medium-term average is acting as resistance rather than support, and ETH would need a sustained move above $2,615 to neutralize the recent downtrend. Compare this to BTC, where price is trading above both averages: the divergence in positioning is stark.
The 30-day range for ETH spans $2,359 to $2,807. The current price of $2,514 sits in the lower-middle of that band, closer to the monthly low than the high. The 30-day high at $2,807 is about 11.7% above spot — a substantial distance — while the 30-day low at $2,359 is only about 6.2% below. That asymmetry reflects the recent weakness: ETH has spent the past week pressing toward the lower end of its monthly range, with the 7-day low of $2,406 coming within 2% of the 30-day floor.
Momentum confirms the softer tone. RSI(14) at 36.2 is in the lower portion of the neutral band and approaching the conventional oversold threshold of 30. Unlike BTC's perfectly balanced 49.2 reading, ETH's RSI indicates that selling pressure has been persistent enough to push momentum toward stretched territory. That said, 36.2 is not yet oversold, and there is no confirmed reversal signal — merely a market that has weakened faster than its larger peer.
Volume mirrors BTC's pattern: 0.78x the 7-day average, below normal. The 2.72% bounce occurred on light participation, which limits its significance as a reversal signal. Thin volume in both assets suggests the market as a whole is in a wait-and-see posture.
Key levels for ETH: immediate support at the 7-day low of $2,406, with the 30-day low at $2,359 as the critical floor. Resistance begins at the MA30 of $2,615, followed by the 7-day high of $2,700 and the 30-day high of $2,807. Until price reclaims the 30-day average, the medium-term structure favors sellers.
Key Technical Levels
| Asset | Support | Resistance | RSI |
|---|---|---|---|
| BTC | $80,394 (7d low) / $74,968 (30d low) | $85,598 (7d high) / $87,396 (30d high) | 49.2 — neutral |
| ETH | $2,406 (7d low) / $2,359 (30d low) | $2,615 (MA30) / $2,700 (7d high) / $2,807 (30d high) | 36.2 — neutral, approaching oversold |
BTC vs ETH Dynamic
The two majors are moving in the same direction today but with different underlying strength. Both posted green 24-hour candles — BTC +1.96%, ETH +2.72% — and both did so on below-average volume, at 0.76x and 0.78x their respective 7-day averages. That shared characteristic suggests a broad, low-conviction bid rather than asset-specific demand. The divergence appears over longer windows: BTC is down 2.45% on the week versus ETH's 6.81%, and BTC holds a +6.73% 30-day return while ETH is flat at -0.08%. The RSI spread — 49.2 for BTC versus 36.2 for ETH — reinforces that ETH has absorbed more selling pressure. Structurally, BTC trades above both its MA7 and MA30 while ETH trades below its MA30, meaning Bitcoin is consolidating within its range whereas Ethereum is testing the lower half of its own. The correlation remains intact on a daily basis, but capital appears to be favoring BTC on a relative-strength basis over the past week and month.
Strategy Fit
Today's conditions — compressed moving averages on BTC, a neutral RSI at 49.2, ETH's RSI at 36.2, and volume at roughly three-quarters of normal on both assets — describe a range-bound, low-volatility regime rather than a trending one. Neither asset has broken its 7-day or 30-day extremes, and momentum is mid-range or weaker. In such environments, mean-reversion and accumulation approaches tend to be more structurally aligned than momentum-chasing.
For range-bound conditions, grid strategies are commonly used because they systematically buy lower in a defined band and sell higher, profiting from oscillation rather than direction. BTC's tight MA convergence and well-defined $80,394–$85,598 weekly range make it a candidate for grid parameters; ETH's wider relative range and lower RSI introduce more downside risk, so any grid would need wider bounds. Dollar-cost averaging (DCA) is another approach that fits neutral-to-weak momentum, as it removes timing decisions and averages entry across time — relevant for ETH given its RSI at 36.2 and position below MA30. Trend-following strategies, by contrast, generally require a confirmed breakout with volume expansion, which is absent today given sub-1.0x volume ratios.
Pionex offers built-in bots that map directly to these regimes — grid trading bots, DCA bots, and trend-oriented bots — allowing users to implement a chosen approach without building infrastructure. The appropriate fit depends on individual risk tolerance and market view; the data above simply describes an environment where range and accumulation logic are more consistent with current conditions than momentum logic.
Risk Disclaimer
This article is for informational purposes only and does not constitute financial, investment, or trading advice. Cryptocurrency markets are highly volatile and can result in the total loss of capital. All prices, levels, and indicators referenced are historical data points as of 2026-10-13 and do not predict future performance. Nothing here should be interpreted as a recommendation to buy, sell, or hold any asset. Readers should conduct their own research and consult a qualified financial professional before making any investment decision. Past performance is not indicative of future results.
FAQ
What was Bitcoin's price on 2026-10-13?
BTC/USDT closed at $83,453, up 1.96% over 24 hours, with a daily range of $81,034 to $84,168.
How did Ethereum perform on the same day?
ETH/USDT closed at $2,514, up 2.72% over 24 hours, trading between $2,409 and $2,539.
What do the RSI readings indicate?
BTC's RSI(14) was 49.2, which is neutral. ETH's RSI(14) was 36.2, also neutral but closer to the oversold threshold of 30.
Are BTC and ETH in an uptrend or downtrend?
On a 7-day basis both are down — BTC -2.45% and ETH -6.81%. On a 30-day basis BTC is up 6.73% while ETH is flat at -0.08%. BTC trades above both its MA7 and MA30; ETH trades below its MA30.
What technical levels matter most right now?
For BTC, support at $80,394 and resistance at $85,598. For ETH, support at $2,406 and resistance at the MA30 of $2,615.


