BTC ETH Daily Recap — 2026-10-10

BTC ETH Daily Recap — 2026-10-10
Today at a Glance
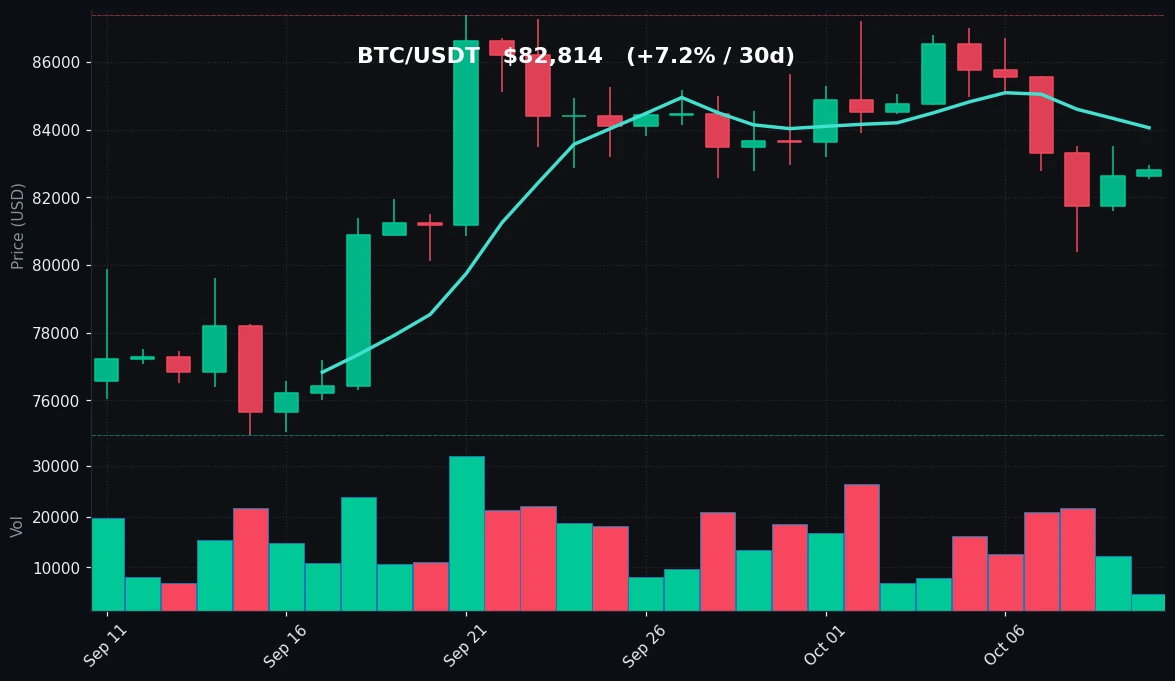
Bitcoin is trading at $82,814, up a marginal +0.22% over the past 24 hours, with an intraday range of just $406 between $82,546 and $82,952. That narrow band is the headline: realized volatility has compressed sharply even as the broader 7-day picture remains soft at -2.29%. BTC sits between its MA7 ($84,053) and MA30 ($82,302), with RSI(14) at 42.4 — mildly weak but far from washed out. Volume is the real story: at 0.34x the 7-day average, participation has thinned dramatically.
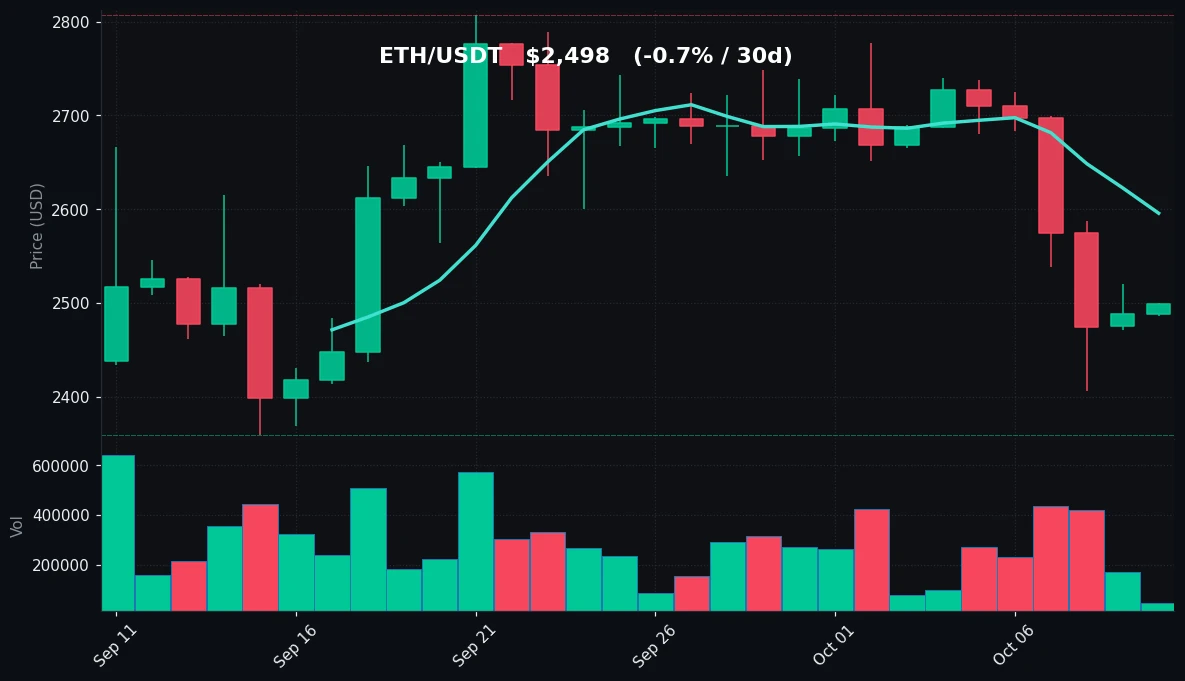
Ethereum is the outlier of the session. ETH printed $2,498, +0.43% on the day, but that green candle masks a brutal -7.03% weekly decline. RSI(14) at 26.4 places ETH firmly in oversold territory, and volume at 0.19x the 7-day average suggests capitulation selling has paused rather than reversed. ETH is trading below both its MA7 ($2,596) and MA30 ($2,615).
Bitcoin Analysis
TradingView Live (4h)
Bitcoin's daily structure is best described as a coiled, low-energy consolidation inside a slightly deteriorating weekly trend. Price at $82,814 is sandwiched between two moving averages that have essentially converged: MA7 at $84,053 and MA30 at $82,302. The spread between them is roughly $1,750, or about 2.1% of spot — unusually tight, and a direct reflection of how muted the last several sessions have been. The 24-hour range of $406 (high $82,952, low $82,546) is remarkably narrow for BTC, reinforcing the compression theme.
Zooming out to the 7-day window tells a more cautious story. BTC is down -2.29% on the week, having traded between $80,394 and $86,999. The 30-day view is constructive at +7.24%, with a range from $74,968 to $87,396. That means the current price sits in the upper-middle portion of the monthly range — roughly $7,800 above the 30-day low and about $4,580 below the 30-day high. In other words, the recent pullback has retraced a portion of a larger advance without breaking the monthly structure.
The key technical levels are clear. On the downside, $82,302 (MA30) is the immediate pivot — a level the market is currently defending. Below that, the 7-day low at $80,394 is the more meaningful support shelf; a loss there would put the 30-day low at $74,968 back in play. On the upside, $84,053 (MA7) is the first hurdle, followed by $86,999 (7-day high) and $87,396 (30-day high), which together form a dense resistance cluster near the monthly peak.
Momentum is neutral-to-soft. RSI(14) at 42.4 is below the midline but well above the 30 level that typically signals oversold conditions. That reading is consistent with a market that has cooled off without being sold aggressively. The volume picture reinforces this: at 0.34x the 7-day average, there is simply not much conviction in either direction. Thin volume during consolidation can cut both ways — it makes the market vulnerable to sharp moves on modest order flow, but it also means there is little evidence of distribution or accumulation at scale. For now, the tape reads as patient, not panicked.
Ethereum Analysis
TradingView Live (4h)
Ethereum is trading at $2,498, up +0.43% in the last 24 hours within an extremely tight range of $2,486 to $2,500. That intraday stability stands in stark contrast to the weekly damage: ETH is down -7.03% over seven days, having fallen from a 7-day high of $2,740 to a low of $2,406. The 30-day change is roughly flat at -0.71%, with a monthly range of $2,359 to $2,807. So while the week has been painful, the month has effectively been a round trip.
The moving average configuration is bearish. ETH trades below both its MA7 ($2,596) and MA30 ($2,615), and the two averages are nearly identical — a sign that the recent decline has flattened the short- and medium-term trend into a single overhead band. For bulls, reclaiming the $2,596–$2,615 zone would be the first meaningful step toward repairing structure. Until then, rallies into that area are likely to meet supply.
The standout data point is RSI(14) at 26.4. That is decisively oversold — below the 30 threshold and approaching levels that historically coincide with exhaustion of selling pressure. Combined with volume at just 0.19x the 7-day average, the picture is one of a market that has sold off hard and then gone quiet. Low volume during an oversold condition often reflects seller fatigue: the aggressive sellers have already transacted, and remaining holders are not yet motivated to sell into weakness. It does not, however, confirm a bottom — it simply describes a pause.
Key levels for ETH: immediate support sits at the 7-day low of $2,406, with the 30-day low at $2,359 just beneath it. A break below $2,359 would mark a fresh monthly low and shift the narrative materially. On the topside, $2,596 (MA7) and $2,615 (MA30) form the first resistance band, followed by $2,740 (7-day high) and $2,807 (30-day high). ETH's underperformance relative to BTC — -7.03% versus -2.29% on the week — is the defining cross-asset theme of this recap.
Key Technical Levels
| Asset | Support | Resistance | RSI |
|---|---|---|---|
| BTC | $82,302 (MA30) / $80,394 (7d low) | $84,053 (MA7) / $86,999 (7d high) | 42.4 — neutral |
| ETH | $2,406 (7d low) / $2,359 (30d low) | $2,596 (MA7) / $2,615 (MA30) | 26.4 — oversold |
BTC vs ETH Dynamic
The correlation between the two majors remains high in direction but has diverged sharply in magnitude. Both assets are in drawdown on the week and both are trading below their short-term moving averages, but ETH's -7.03% weekly decline is roughly three times BTC's -2.29%. That gap has pushed ETH's RSI down to 26.4 while BTC sits at a comparatively comfortable 42.4. The divergence is also visible in volume: BTC at 0.34x its 7-day average versus ETH at 0.19x. In practice, this means capital has rotated toward BTC on a relative basis during the pullback — a familiar risk-off pattern within crypto, where the largest, most liquid asset absorbs flows while higher-beta names de-rate. The immediate implication is that ETH's recovery path is steeper: it must first reclaim $2,596–$2,615 just to return to neutral trend positioning, whereas BTC only needs to clear $84,053. If BTC stabilizes above its MA30, ETH's oversold reading could set up a mean-reversion bounce — but if BTC loses $82,302, ETH's $2,359 monthly low becomes the level to watch.
Strategy Fit
Today's conditions — compressed intraday ranges, thin volume, and a clear divergence between a neutral BTC and an oversold ETH — favor different approaches for different assets. BTC's tight $406 daily range and sub-average volume make it a candidate for range-bound strategies, where a grid bot can harvest small oscillations between the $82,302 support and $84,053 resistance zone. Pionex's built-in grid trading bot is designed for exactly this kind of low-volatility, range-bound environment, automatically placing buy and sell orders at preset intervals.
ETH presents a different profile. With RSI at 26.4 and price down -7.03% on the week, the asset is in oversold territory where volatility has historically been elevated — but current volume at 0.19x average suggests the market is waiting. For participants with a longer horizon, a DCA (dollar-cost averaging) bot can spread entries across time rather than trying to time a single bottom, which suits an oversold-but-unconfirmed setup. Pionex offers a built-in DCA bot for this purpose. Trend-following strategies, by contrast, are poorly suited to both assets right now: BTC has no clear directional momentum (RSI 42.4, price between MAs), and ETH's trend is down but with exhaustion signals. Neither offers the clean, sustained directional move that trend bots require. The honest summary: this is a range-and-accumulate tape, not a momentum tape.
Risk Disclaimer
This article is for informational purposes only and does not constitute financial, investment, or trading advice. All data cited is historical and does not predict future results. Cryptocurrency markets are highly volatile and can result in the total loss of capital. Technical indicators such as RSI, moving averages, and volume ratios are descriptive tools, not guarantees. You should conduct your own research and consult a qualified financial professional before making any trading decision. The mention of any trading bot or platform is not an endorsement, and automated strategies carry their own risks, including execution and market risks.
FAQ
What is Bitcoin's price on 2026-10-10?
BTC/USDT is trading at $82,814, up +0.22% over 24 hours, with an intraday high of $82,952 and low of $82,546.
What is Ethereum's price on 2026-10-10?
ETH/USDT is trading at $2,498, up +0.43% over 24 hours, with an intraday high of $2,500 and low of $2,486.
Why is ETH's RSI so much lower than BTC's?
ETH has fallen -7.03% over the past 7 days versus BTC's -2.29%, pushing its RSI(14) to 26.4 (oversold) while BTC sits at 42.4 (neutral). The divergence reflects relative capital rotation toward BTC during the pullback.
What are the key support and resistance levels right now?
For BTC, support is at $82,302 (MA30) and $80,394 (7-day low), with resistance at $84,053 (MA7) and $86,999 (7-day high). For ETH, support is at $2,406 (7-day low) and $2,359 (30-day low), with resistance at $2,596 (MA7) and $2,615 (MA30).
What strategy suits today's market conditions?
BTC's tight range and low volume favor grid strategies, while ETH's oversold RSI and subdued volume suit a DCA approach. Trend-following is less appropriate given the lack of clear directional momentum. Pionex offers built-in grid and DCA bots for these use cases. This is not financial advice.


