BTC ETH Daily Recap – July 14, 2026

BTC ETH Daily Recap – July 14, 2026
Today at a Glance
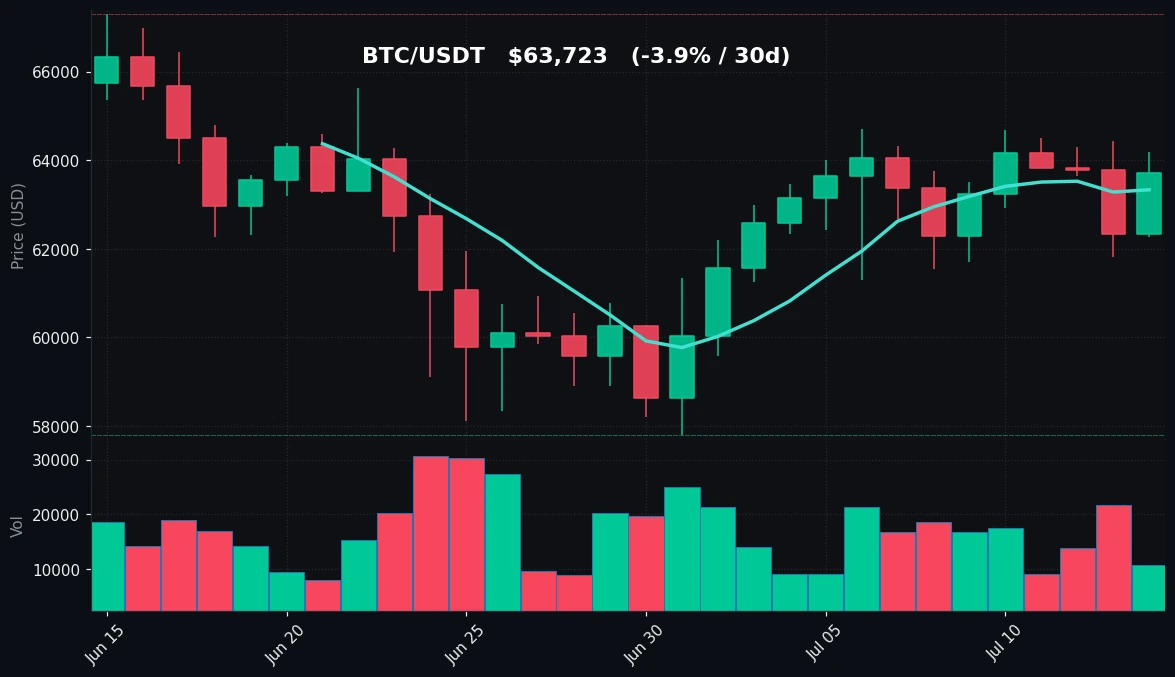
On July 14, 2026, Bitcoin and Ethereum both recorded positive daily performance, with Ethereum leading the charge. Bitcoin rose 2.23% to $63,723, trading within a narrow range between $62,272 and $64,182. The asset remains in a neutral-to-bullish posture, with its 7-day moving average ($63,334) now above the 30-day MA ($62,618), signaling short-term upward momentum. However, volume is notably subdued at 0.66x the 7-day average, suggesting the move is not yet backed by strong participation.
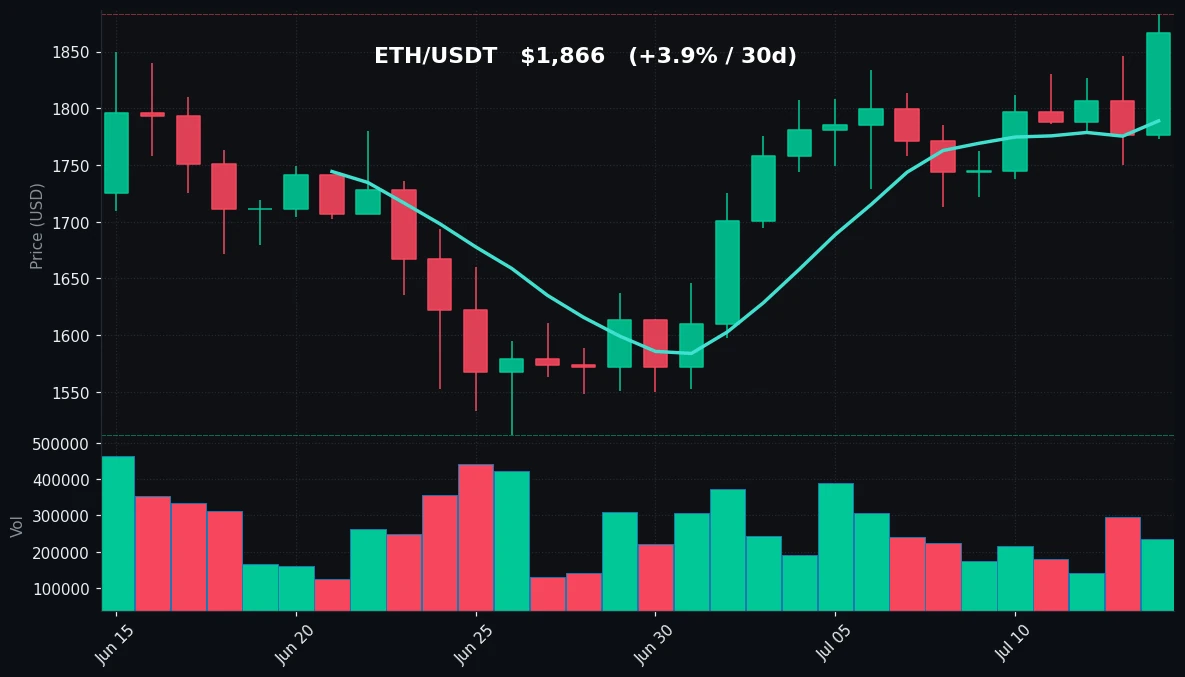
Ethereum outperformed with a 5.03% daily gain, reaching $1,866 and hitting a fresh 30-day high of $1,883. Its 7-day return of +5.35% and 30-day return of +3.90% indicate a more sustained recovery compared to Bitcoin. The RSI(14) at 80.4 pushes into overbought territory, while volume surged to 1.12x the 7-day average, confirming buyer conviction. The divergence in momentum between BTC and ETH is a key theme to watch.
Bitcoin Analysis
TradingView Live (4h)
Bitcoin’s price action on July 14 reflects a cautious recovery from recent consolidation. After touching a 30-day low of $57,800 on June 14, BTC has since climbed back above both its 7-day and 30-day moving averages, now at $63,334 and $62,618 respectively. The current price of $63,723 sits just above these levels, indicating that short-term traders are gaining control.
The 7-day high of $64,693 and today’s intraday high of $64,182 suggest resistance is forming near $64,200–$64,700. On the downside, support is seen at the 7-day MA of $63,334, with stronger support at the 30-day MA of $62,618. A break below these levels could open a path toward the $61,545 area, which marked the 7-day low.
Volume is a concern: at 0.66x the 7-day average, today’s move lacks the conviction needed for a sustained breakout. This low volume environment often precedes either a quiet consolidation or a sudden volatility expansion. The RSI(14) at 70.8 is approaching overbought territory (typically 70+), but not yet extreme. Historically, RSI between 70 and 75 on Bitcoin can persist for several days during uptrends before a pullback occurs.
Key technical observations:
- Price above both MAs: bullish short-term structure
- Volume declining: potential for false breakout or range extension
- RSI near overbought: caution for aggressive longs
- 30-day range of $57,800–$67,292 provides a wide context: BTC is currently in the middle of this range
No directional prediction is made, but the current setup favors a watch-and-wait approach for traders until volume confirms the next move.
Ethereum Analysis
TradingView Live (4h)
Ethereum’s performance on July 14 was notably stronger than Bitcoin’s, with a 5.03% daily gain and a 30-day high of $1,883. The asset has now recovered from a 30-day low of $1,512 on June 14, representing a 24.5% recovery in one month. The 7-day moving average at $1,789 is well above the 30-day MA at $1,714, confirming a bullish crossover that occurred earlier this week.
Today’s price of $1,866 sits above both MAs, with the 7-day high matching today’s high at $1,883. This level is acting as immediate resistance. Support is at $1,789 (7-day MA) and $1,714 (30-day MA). A pullback to these levels would be healthy for the trend.
Volume is strong: at 1.12x the 7-day average, today’s move is supported by higher-than-normal participation. This is a constructive sign, as it suggests genuine buying interest rather than a low-volume spike. The RSI(14) at 80.4 is firmly in overbought territory. Readings above 80 are rare and often precede short-term corrections or consolidation. However, in strong trending markets, RSI can remain overbought for extended periods.
Key technical observations:
- Bullish MA crossover (7-day above 30-day): trend shift confirmed
- Volume above average: conviction behind the move
- RSI(14) at 80.4: overbought, caution warranted
- 30-day range of $1,512–$1,883: ETH is at the top of this range, facing resistance
The divergence between ETH’s strong volume and BTC’s weak volume is notable and may indicate capital rotation from BTC to ETH in the short term.
Key Technical Levels
| Asset | Support | Resistance | RSI |
|---|---|---|---|
| BTC | $63,334 (MA7), $62,618 (MA30) | $64,182 (24h high), $64,693 (7d high) | 70.8 – approaching overbought |
| ETH | $1,789 (MA7), $1,714 (MA30) | $1,883 (24h/7d high) | 80.4 – overbought |
BTC vs ETH Dynamic
The correlation between Bitcoin and Ethereum remains positive but is showing signs of divergence in momentum. Over the past 7 days, BTC gained 0.57% while ETH surged 5.35%, a clear outperformance. Over the past 30 days, BTC declined 3.93% while ETH gained 3.90%, indicating that ETH has been recovering faster from the June lows. This divergence is often seen during market transitions where altcoins and ETH lead while BTC consolidates. The current ratio of ETH to BTC is approximately 0.0293, up from 0.0260 one week ago, reflecting ETH’s relative strength. If this trend continues, it may signal a broader risk-on shift in crypto markets. However, if BTC fails to break resistance, ETH’s overbought RSI could lead to a cooldown that pulls both assets lower.
Strategy Fit
Given the current market conditions — BTC with low volume and ETH with overbought RSI — a neutral-to-cautious approach is warranted.
-
Grid Trading: Suitable for both BTC and ETH in the current range-bound environment. BTC’s range of $61,500–$64,700 over the past 7 days provides a clear grid zone. ETH’s range of $1,713–$1,883 over the same period also works well for neutral grids. Pionex’s built-in grid bots can automate this strategy, capturing profits from small price oscillations without directional bias.
-
DCA (Dollar-Cost Averaging): Appropriate for long-term accumulation, especially if traders believe the current levels are within a broader accumulation zone. BTC near $63,700 and ETH near $1,866 are neither at 30-day highs nor lows, making them neutral DCA entry points. Pionex’s DCA bot allows for automated periodic buys with adjustable parameters.
-
Trend Following: Not recommended for BTC due to low volume and RSI near overbought. For ETH, the trend is clearly up, but the overbought RSI suggests waiting for a pullback before initiating trend-following positions. A trend-following approach could use Pionex’s infinity grid or trailing stop bots once a clearer breakout with volume is confirmed.
Risk Disclaimer
This market recap is for informational and educational purposes only. It does not constitute financial advice, investment recommendations, or solicitation to buy or sell any cryptocurrency. Past performance and technical indicators are not guarantees of future results. Cryptocurrency markets are highly volatile and involve substantial risk. Always conduct your own research and consult with a qualified financial advisor before making any investment decisions. The author and platform may hold positions in the assets discussed.
FAQ
Q: Why did Ethereum rally more than Bitcoin today?
A: Ethereum’s 5.03% gain was driven by stronger volume (1.12x vs 0.66x for BTC) and a bullish MA crossover earlier this week. ETH also had more room to run from its 30-day low of $1,512 compared to BTC’s $57,800 low.
Q: Is Bitcoin’s low volume a concern?
A: Yes, volume at 0.66x the 7-day average suggests the move lacks broad participation. Low-volume rallies are more vulnerable to sudden reversals. Traders should watch for volume confirmation above the 7-day average.
Q: What does ETH’s RSI of 80.4 mean?
A: An RSI above 70 is considered overbought, and above 80 is extreme. Historically, this can precede a short-term pullback or consolidation. However, in strong uptrends, RSI can stay elevated for days. It’s a warning sign, not a sell signal.
Q: Should I use a grid bot now?
A: Grid trading can be effective in range-bound markets. BTC’s 7-day range ($61,545–$64,693) and ETH’s range ($1,713–$1,883) provide clear boundaries. Pionex’s grid bots can automate this strategy. Be aware that a breakout beyond these ranges could cause the grid to underperform.
Q: What are the key levels to watch tomorrow?
A: For BTC, watch $64,182 (today’s high) as resistance and $63,334 (MA7) as support. For ETH, $1,883 is resistance and $1,789 (MA7) is support. A close above resistance with volume would be bullish; a break below support could signal a trend reversal.


