BTC ETH Daily Recap — June 16, 2026

BTC ETH Daily Recap — June 16, 2026
Today at a Glance
The crypto market opened the week with mixed signals on June 16, 2026. Bitcoin (BTC) traded at $66,190, down 0.21% in the last 24 hours, after touching a daily high of $66,992 and a low of $65,650. Despite the slight intraday pullback, BTC maintains a strong weekly performance of +7.23%, recovering from a 30-day low of $59,131. Ethereum (ETH) showed mild relative strength, gaining 0.38% to $1,803, with a daily range between $1,758 and $1,840. ETH’s weekly gain of +9.97% outpaces BTC, though both assets remain in negative territory over the past 30 days (BTC -14.04%, ETH -15.36%). Volume remains subdued — BTC trading at 57% of its 7-day average, ETH at 85% — suggesting cautious sentiment as the market consolidates after last week’s rally. RSI readings (BTC 48.1, ETH 45.8) indicate neutral territory, leaving room for either continuation or reversal.
Bitcoin Analysis
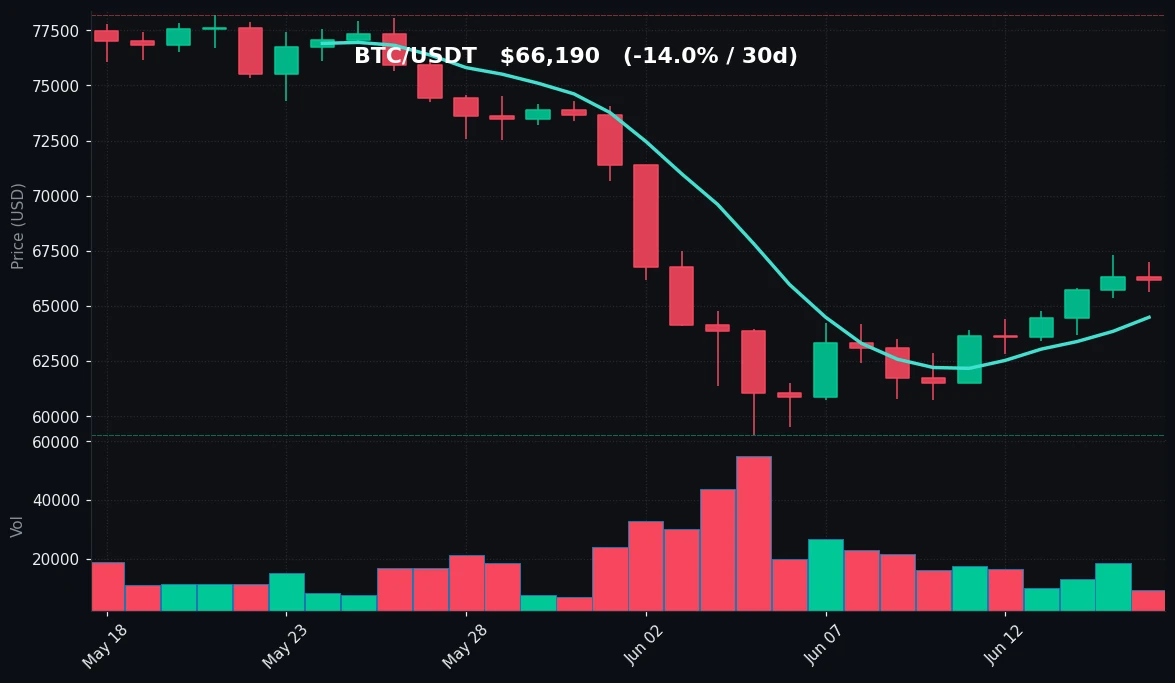
TradingView Live (4h)
Bitcoin is currently trading at $66,190, positioned above its 7-day moving average (MA7: $64,492) but below the 30-day moving average (MA30: $69,614). This price structure indicates that while short-term momentum has improved over the past week — BTC rallied from a 7-day low of $60,755 to a high of $67,292 — the medium-term trend remains bearish, as the MA30 continues to act as overhead resistance. The gap between MA7 and MA30 ($69,614 vs $64,492) reflects a bearish crossover that has yet to be resolved.
The 24-hour range ($65,650–$66,992) is relatively narrow compared to the 7-day range ($60,755–$67,292), suggesting a consolidation phase after last week’s recovery. Volume is notably low at 0.57x the 7-day average, confirming reduced trader participation. This volume contraction often precedes either a breakout or a breakdown, as liquidity thins.
The RSI(14) at 48.1 sits just below the neutral 50 level, indicating neither overbought nor oversold conditions. This is a key observation: the RSI has recovered from deeply oversold levels seen during the 30-day low of $59,131 (where RSI likely dipped below 30) but has not yet crossed into bullish territory above 50. The 30-day high of $78,200 remains distant, and the 30-day low of $59,131 provides a critical floor.
Key technical levels to watch: Immediate support lies at $65,650 (today’s low) and stronger support at $60,755 (7-day low). Resistance is at $66,992 (today’s high) and $67,292 (7-day high), with major resistance at the MA30 of $69,614. The inability to reclaim $70,000 keeps the medium-term outlook cautious. Without a catalyst to drive volume higher, BTC may remain range-bound between $64,500 and $67,300 in the short term.
Ethereum Analysis
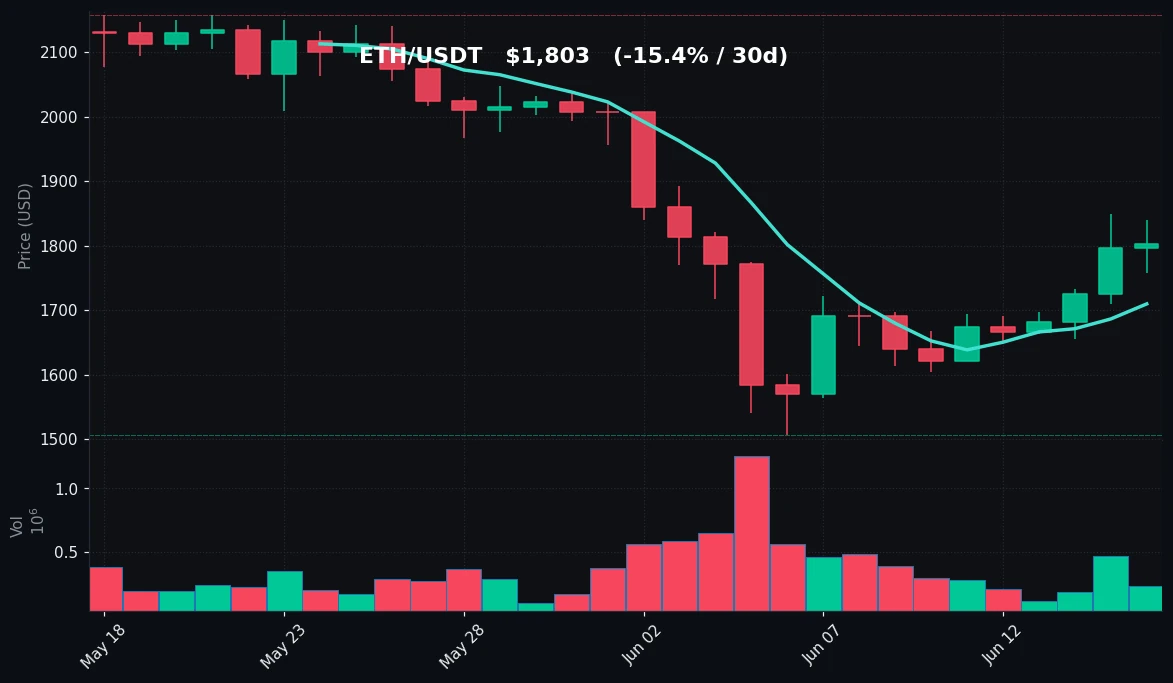
TradingView Live (4h)
Ethereum is trading at $1,803, up 0.38% on the day, with a daily high of $1,840 and low of $1,758. The asset has shown stronger weekly momentum than BTC, gaining 9.97% over the past seven days, recovering from a 7-day low of $1,603 to a high of $1,850. This outperformance is noteworthy, as ETH had previously suffered a steeper 30-day decline (-15.36%) compared to BTC (-14.04%).
ETH’s price sits above its MA7 of $1,710 but below the MA30 of $1,888, mirroring BTC’s structure. The MA7-MA30 gap ($1,710 vs $1,888) is wider in percentage terms than BTC’s, reflecting ETH’s deeper medium-term correction. The 30-day range spans from a low of $1,506 to a high of $2,158, meaning ETH has recovered approximately 30% from its 30-day low but remains 16.5% below its 30-day high.
Volume is at 0.85x the 7-day average, higher than BTC’s relative volume but still below normal levels. This suggests moderate interest in ETH, possibly driven by last week’s recovery rally. The RSI(14) at 45.8 is in neutral territory, slightly lower than BTC’s 48.1, indicating that ETH’s recovery momentum may be slightly weaker on a relative basis.
Key technical levels: Support at $1,758 (today’s low) and $1,603 (7-day low). Resistance at $1,840 (today’s high) and $1,850 (7-day high), with the MA30 at $1,888 as the primary overhead barrier. A break above $1,888 would signal a potential trend reversal, while a drop below $1,758 could retest the $1,600 support zone. The 30-day low of $1,506 remains a critical downside risk level.
Key Technical Levels
| Asset | Support | Resistance | RSI |
|---|---|---|---|
| BTC | $65,650 (daily low), $60,755 (7d low) | $66,992 (daily high), $67,292 (7d high), $69,614 (MA30) | 48.1 — Neutral |
| ETH | $1,758 (daily low), $1,603 (7d low) | $1,840 (daily high), $1,850 (7d high), $1,888 (MA30) | 45.8 — Neutral |
BTC vs ETH Dynamic
The correlation between Bitcoin and Ethereum remains strong, as both assets exhibit similar technical structures: trading above their 7-day moving averages but below their 30-day moving averages, with RSI readings in neutral territory. However, ETH’s 24-hour performance (+0.38%) slightly outperformed BTC (-0.21%), and its weekly gain of +9.97% exceeded BTC’s +7.23%. This divergence suggests that ETH may be experiencing catch-up buying after its deeper correction (30-day drawdown of -15.36% vs BTC’s -14.04%). The ETH/BTC ratio has edged higher, though not dramatically. Volume dynamics differ: ETH’s relative volume (0.85x vs 7d avg) is higher than BTC’s (0.57x), indicating relatively more active trading in ETH. This could be a precursor to either relative strength continuing or a mean reversion if BTC volume returns. Overall, the two assets remain tightly coupled in direction but show subtle differences in momentum intensity.
Strategy Fit
Given the current market conditions — neutral RSI, below-average volume, and prices between short-term and medium-term moving averages — a range-bound, low-volatility strategy is most appropriate. The market appears to be consolidating after last week’s recovery, with no clear directional catalyst.
Grid trading is well-suited to this environment. With BTC oscillating between $65,650 and $66,992 (a $1,342 range) and ETH between $1,758 and $1,840 (an $82 range), a grid bot can profit from these small intraday fluctuations. Pionex’s built-in grid trading bots allow users to set upper and lower price bounds within these ranges, automatically buying low and selling high. Given the low volume, narrow grids with tight spacing may capture multiple trades.
Dollar-cost averaging (DCA) is also appropriate for longer-term accumulators. With BTC 15% below its 30-day high and ETH 16.5% below, prices are discounted relative to recent peaks. Pionex’s DCA bots can automate periodic purchases, reducing timing risk. However, traders should be aware that the MA30 resistance ($69,614 for BTC, $1,888 for ETH) may cap upside in the near term.
Trend-following strategies are less recommended today. RSI readings near 50 and below-average volume suggest no clear trend. A trend-following bot would risk false signals in this choppy environment. Traders should wait for a volume expansion and a breakout above the MA30 before activating trend strategies.
Pionex users can leverage the built-in arbitrage bot if spreads widen between exchanges, or use the infinity grid bot for asymmetric upside exposure with downside protection. The current low-volatility, neutral-RSI setup favors mean-reversion strategies over momentum plays.
Risk Disclaimer
This market recap is for informational and educational purposes only. It does not constitute financial advice, investment recommendation, or solicitation to buy or sell any digital asset. Cryptocurrency markets are highly volatile and involve substantial risk of loss. Past performance does not guarantee future results. Always conduct your own research, assess your risk tolerance, and consult with a qualified financial advisor before making investment decisions. The data presented is based on publicly available information and may contain errors or omissions. The author and platform assume no liability for any losses incurred.
FAQ
Q: Why is Bitcoin’s volume so low compared to its 7-day average?
A: Bitcoin’s volume is at 57% of its 7-day average, indicating reduced trader participation. This often occurs during consolidation phases after a significant price move (last week’s +7.23% rally). Low volume can precede either a breakout or a breakdown, as liquidity thins and price moves become more sensitive to large orders.
Q: What does RSI of 48.1 mean for Bitcoin?
A: An RSI of 48.1 is in neutral territory (between 30 and 70). It suggests neither overbought nor oversold conditions. This leaves room for the price to move in either direction without being constrained by extreme sentiment. It also indicates that last week’s recovery from $60,755 has not yet generated strong bullish momentum.
Q: Why is Ethereum outperforming Bitcoin today and this week?
A: Ethereum’s weekly gain of +9.97% exceeds Bitcoin’s +7.23%, likely due to catch-up buying after ETH’s deeper 30-day correction (-15.36% vs BTC’s -14.04%). ETH also has a wider 30-day range ($1,506–$2,158) than BTC ($59,131–$78,200), meaning its recovery from the low has more percentage upside potential.
Q: What are the key resistance levels to watch for a bullish breakout?
A: For Bitcoin, the key resistance is $69,614 (MA30) and then $70,000 psychological level. For Ethereum, resistance is at $1,888 (MA30) and $2,000 psychological level. A daily close above these levels with increased volume would signal a potential trend reversal from the 30-day downtrend.
Q: Should I use a grid bot or a DCA bot in current conditions?
A: Both are viable but serve different purposes. A grid bot is ideal for profiting from the current range-bound price action within $65,650–$66,992 (BTC) and $1,758–$1,840 (ETH). A DCA bot is better for long-term accumulation at discounted prices (15–16% below 30-day highs). Pionex offers both bot types built-in, allowing traders to choose based on their time horizon and risk preference.


