BTC ETH Daily Recap – June 13, 2026
BTC ETH Daily Recap – June 13, 2026
Today at a Glance
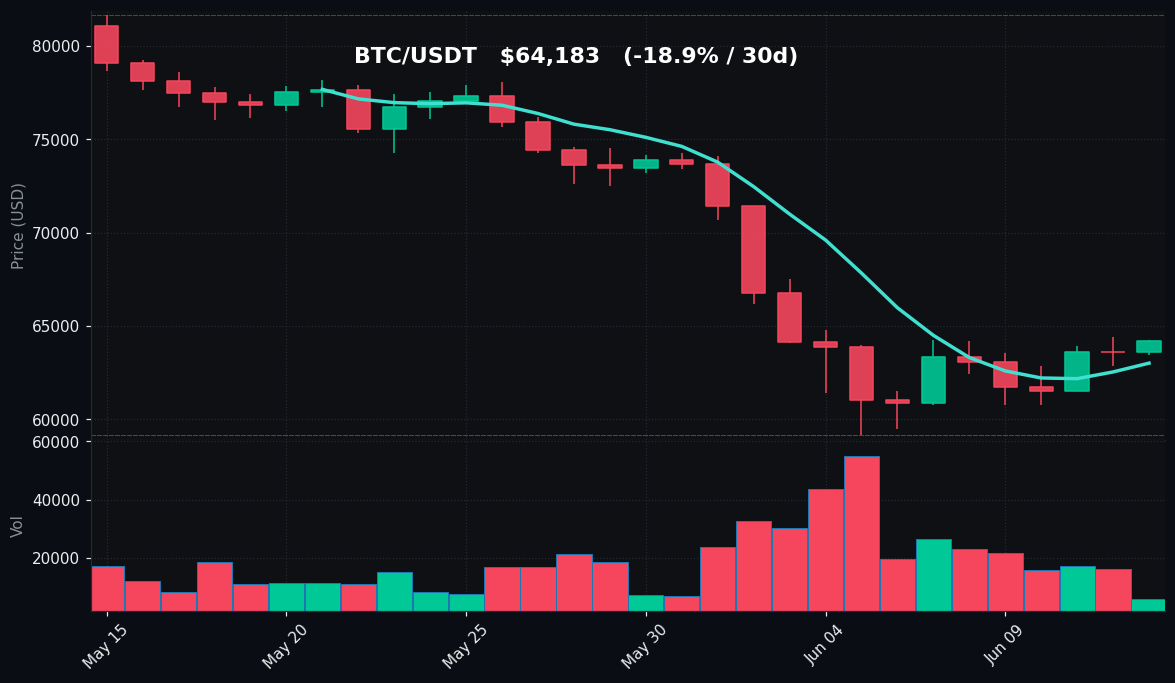
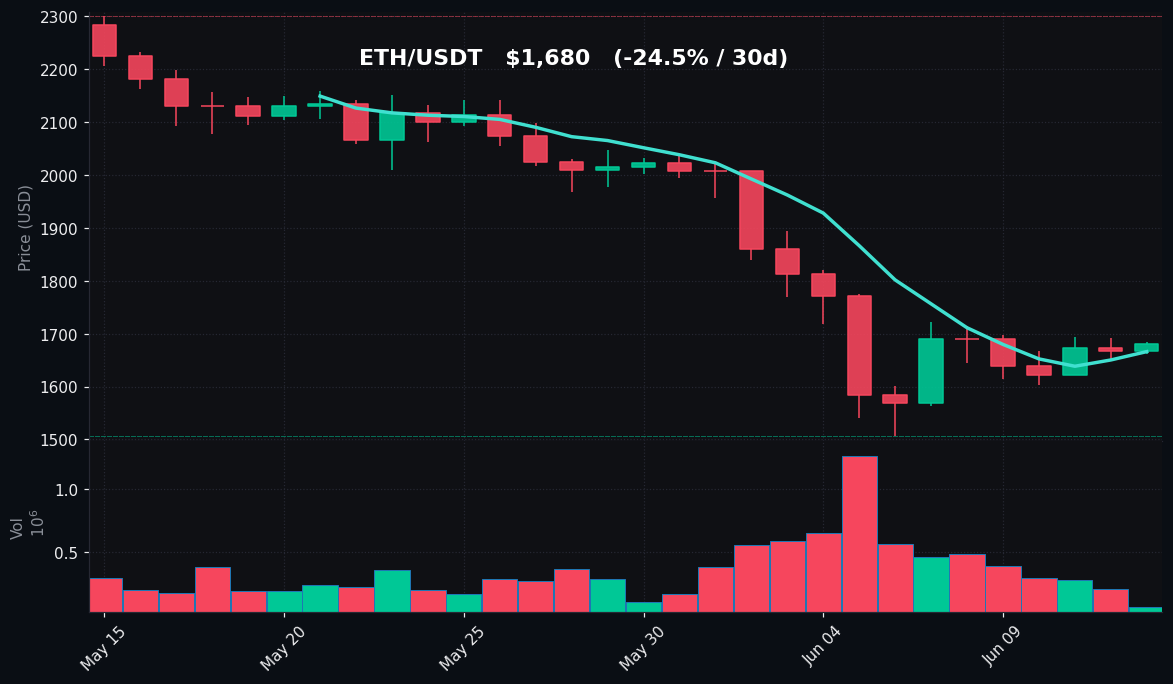
The crypto market showed cautious optimism on June 13, 2026, with both Bitcoin (BTC) and Ethereum (ETH) posting modest gains over the past 24 hours. BTC rose 0.95% to $64,183, recovering from a daily low of $63,419 and approaching a 7-day high of $64,394. ETH followed a similar trajectory, gaining 0.82% to $1,680, with a daily range between $1,662 and $1,684. Despite the short-term bounce, both assets remain under significant pressure over the past 30 days, with BTC down 18.87% and ETH down 24.48% from their 30-day highs. Notably, trading volumes for both assets are sharply below their 7-day averages—BTC at 0.3x and ETH at 0.16x—indicating thin participation. The 7-day trends are positive (BTC +5.42%, ETH +7.04%), but the RSI readings of 25.8 (BTC) and 26.1 (ETH) remain deep in oversold territory, suggesting the market is still searching for a sustainable bottom.
Bitcoin Analysis
TradingView Live (4h)
Bitcoin’s price action on June 13 reveals a market attempting to stabilize after a brutal 30-day correction. The current price of $64,183 sits above the 7-day moving average (MA7) of $63,007, a bullish short-term signal that suggests buyers are stepping in at lower levels. However, the asset remains well below the 30-day moving average (MA30) of $70,820, confirming the medium-term downtrend is intact. The 24-hour high of $64,246 is just shy of the 7-day high of $64,394, indicating that resistance near $64,400 is being tested.
The RSI(14) reading of 25.8 is deeply oversold—anything below 30 is typically considered a sign of exhaustion among sellers. Historically, such levels have preceded short-term bounces, but they do not guarantee a reversal. The volume profile raises concern: current volume is only 0.3x the 7-day average, meaning the rally is occurring on relatively low participation. This could indicate a lack of conviction, and the move may be driven by short-term speculators rather than sustained buying.
Key technical levels to watch include immediate support at the 7-day low of $60,746, followed by the 30-day low of $59,131, which marks the year-to-date floor. On the upside, resistance is clustered around $64,400 (7-day high) and then the psychological $65,000 level. A break above $65,000 could open the door to retesting the MA30 at $70,820, though that would require a significant increase in volume. The current environment suggests a consolidation phase, with the market waiting for a catalyst—either a macroeconomic event or a shift in sentiment—to determine the next directional move.
Ethereum Analysis
TradingView Live (4h)
Ethereum’s performance mirrors Bitcoin’s but with slightly more pronounced volatility over the past week. At $1,680, ETH is trading above its 7-day MA of $1,666, a modestly bullish signal. However, like BTC, it remains far below the 30-day MA of $1,929, underscoring the severity of the recent sell-off. The 7-day high of $1,722 represents a key resistance level, while the 7-day low of $1,564 and the 30-day low of $1,506 provide downside support.
The RSI(14) of 26.1 is also in oversold territory, slightly higher than BTC’s reading, indicating similar exhaustion among sellers. Volume is even thinner for ETH, at just 0.16x the 7-day average. This is a notable divergence: while prices are recovering, the lack of volume suggests that the move is not broadly supported. It could be a dead cat bounce, where short covering or algorithmic buying pushes prices higher temporarily before a renewed decline.
Ethereum’s 30-day decline of 24.48% is steeper than BTC’s 18.87%, reflecting its higher beta to market movements. The asset’s price action is currently trapped between the 7-day low of $1,564 and the 7-day high of $1,722. A decisive break above $1,722 would target the $1,800 area, while a drop below $1,564 could lead to a retest of the 30-day low at $1,506. The thin volume environment makes both scenarios possible, but the oversold RSI suggests that any further downside may be met with buying interest from value-oriented investors.
Key Technical Levels
| Asset | Support | Resistance | RSI |
|---|---|---|---|
| BTC | $60,746 (7d low), $59,131 (30d low) | $64,394 (7d high), $65,000 (psychological) | 25.8 – Oversold |
| ETH | $1,564 (7d low), $1,506 (30d low) | $1,722 (7d high), $1,800 (round number) | 26.1 – Oversold |
Both assets are firmly in oversold territory, with RSI levels historically associated with potential bounces or at least consolidation. However, the low volume suggests that the market is not yet ready to commit to a sustained recovery.
BTC vs ETH Dynamic
The correlation between Bitcoin and Ethereum remains high, as evidenced by their nearly identical 24-hour performance (+0.95% vs +0.82%) and similar RSI readings (25.8 vs 26.1). Both assets are recovering from 30-day lows, but ETH’s steeper decline (-24.48% vs -18.87%) indicates it is more sensitive to market stress. Over the past week, ETH has outperformed BTC slightly (+7.04% vs +5.42%), which is typical during recovery phases when higher-beta assets attract speculative interest. The volume disparity—BTC at 0.3x vs ETH at 0.16x—suggests that Bitcoin is still the preferred vehicle for institutional or larger traders, while ETH’s thinner liquidity could amplify price swings. The ETH/BTC ratio has likely moved up slightly from recent lows, but it remains in a downtrend over the past month, reflecting Bitcoin’s relative strength in the current risk-off environment.
Strategy Fit
Given the current market conditions—oversold RSI, low volume, and a short-term bounce from recent lows—a grid trading strategy is well-suited for both BTC and ETH. The narrow 24-hour ranges (BTC: ~$800, ETH: ~$22) indicate a market that is consolidating rather than trending. Grid bots can profit from these small price oscillations by placing buy and sell orders within a defined range. For BTC, a grid spanning from $60,000 to $65,000 would capture the current support and resistance levels. For ETH, a grid from $1,550 to $1,750 aligns with the 7-day range.
Dollar-cost averaging (DCA) is also appropriate for long-term holders, given the oversold readings. Accumulating gradually at these levels reduces the risk of buying at a local peak. However, the low volume means that any sudden news could cause sharp moves, so traders should avoid over-leveraging.
Trend-following strategies are not recommended today, as neither asset is in a clear trend. The MA7/MA30 cross is bearish, but the oversold RSI suggests a potential reversal. Pionex’s built-in grid trading bots (e.g., the Infinity Grid or AI Grid) are ideal for this environment, as they automate profit-taking from volatility without requiring directional bets. For more conservative traders, a rebalancing bot could help maintain a fixed allocation between BTC and ETH, capitalizing on their relative performance differences.
Risk Disclaimer
This market recap is for informational and educational purposes only and does not constitute financial advice, investment recommendations, or solicitation to buy or sell any digital assets. Cryptocurrency markets are highly volatile and involve substantial risk of loss. Past performance is not indicative of future results. You should conduct your own research and consult with a qualified financial advisor before making any investment decisions. The author and platform (Pionex) are not responsible for any financial losses incurred based on this content.
FAQ
Q: Why are BTC and ETH RSI levels so low despite recent gains?
A: The RSI (Relative Strength Index) measures the speed and magnitude of price changes over the past 14 periods. Readings below 30 indicate oversold conditions, meaning prices have fallen sharply relative to recent averages. The current RSI of 25.8 (BTC) and 26.1 (ETH) reflects the deep 30-day declines of -18.87% and -24.48%, respectively. The recent 24-hour gains are too small to significantly move the RSI out of oversold territory.
Q: What does low trading volume (0.3x and 0.16x of 7-day average) mean for the market?
A: Low volume relative to the 7-day average indicates reduced market participation. This can mean that the current price moves are driven by a smaller number of traders, making them less reliable. A low-volume rally is more susceptible to sudden reversals if larger players step in to sell. Conversely, low volume during a decline can signal that selling pressure is exhausted.
Q: Is the 7-day positive performance (+5.42% BTC, +7.04% ETH) a sign of a trend reversal?
A: Not necessarily. The 7-day gains are encouraging but occur after significant losses. The market is still below key moving averages (MA30), and the volume is thin. A true trend reversal would typically require sustained volume increases and a break above resistance levels like $64,400 (BTC) and $1,722 (ETH). The current bounce could be a short-term relief rally within a larger downtrend.
Q: How do the 30-day highs and lows inform potential price targets?
A: The 30-day highs ($81,664 BTC, $2,300 ETH) represent recent peaks where sellers overwhelmed buyers. The 30-day lows ($59,131 BTC, $1,506 ETH) are levels where buyers stepped in strongly. These levels act as psychological support and resistance. A break below the 30-day low could signal further downside, while a move above the 30-day high would indicate a strong bullish reversal.
Q: Which trading strategy is safest in this low-volume, oversold environment?
A: Grid trading is generally the safest strategy because it doesn’t rely on predicting direction. It profits from price oscillations within a defined range. Dollar-cost averaging (DCA) is also low-risk for long-term holders. Avoid high-leverage futures or trend-following strategies until volume picks up and a clear trend emerges. Pionex’s grid bots automate this process, reducing emotional decision-making.