BTC ETH Daily Recap: June 2, 2026 — Deep Correction Tests Key Support Levels
BTC ETH Daily Recap: June 2, 2026 — Deep Correction Tests Key Support Levels
Today at a Glance
The crypto market opened the week under significant selling pressure, with both Bitcoin and Ethereum extending their monthly downtrends. Bitcoin (BTC) is trading at $68,700, down 3.79% over the past 24 hours, marking its lowest point in 30 days and breaching the critical $70,000 psychological level. The asset has now fallen 13.98% over the past month, with its 14-day Relative Strength Index (RSI) plunging to 21.2 — deep into oversold territory. Ethereum (ETH) is relatively more resilient in percentage terms, down 1.74% on the day to $1,972, though its 30-day decline of 15.99% is steeper than Bitcoin's. ETH's RSI at 29.3 also signals oversold conditions. Trading volumes for both assets have contracted below their 7-day averages (BTC at 0.92x, ETH at 0.65x), suggesting a lack of aggressive buying interest despite the sharp drops. The week's price action has erased gains from mid-May, with BTC falling from a 7-day high of $76,174 and ETH from $2,097. Technical structures remain bearish as both assets trade below their 7-day and 30-day moving averages.
Bitcoin Analysis
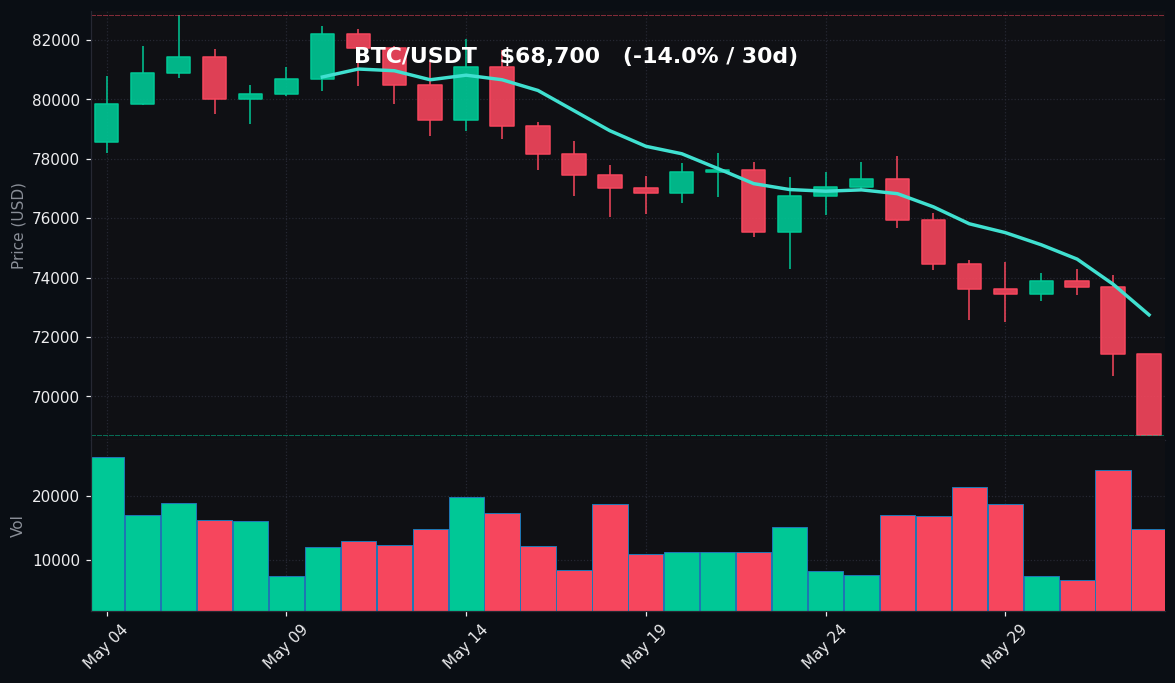
TradingView Live (4h)
Bitcoin's price action on June 2 reflects a continuation of the bearish momentum that began after the asset failed to hold above $76,000 earlier in the week. The current session saw BTC touch an intraday low of $68,677, just $23 above the 30-day low, before settling at $68,700. This level represents a critical test of support, as the $68,500–$69,000 zone has historically acted as both support and resistance over the past month.
From a trend perspective, BTC is now trading firmly below both its 7-day moving average (MA7) of $72,742 and its 30-day moving average (MA30) of $77,449. The gap between price and MA7 is approximately 5.6%, while the price sits 11.3% below the MA30 — a clear sign of sustained bearish momentum. The MA7 crossed below the MA30 on May 28, and the gap has been widening since, confirming a death cross on the short-term moving averages.
Volume analysis reveals a concerning divergence. Despite the 3.79% daily decline, trading volume is only 92% of the 7-day average, indicating that the sell-off is not accompanied by panic-level volume. This could suggest either exhaustion of selling pressure or a lack of conviction from buyers to step in. In oversold conditions, low-volume declines often precede either a snap-back rally or a further grind lower.
The most striking technical indicator is the RSI(14) reading of 21.2. This is deep in oversold territory (below 30) and is the lowest reading observed in the past 30 days. Historically, Bitcoin RSI below 25 has often preceded short-term bounces, but it can also persist in oversold conditions during prolonged downtrends. The last time BTC's RSI was this low (April 2026), the price recovered 8% over the following week. However, the macro context — including the asset trading below both MAs and declining volume — suggests caution.
Key resistance levels to watch are the MA7 at $72,742 and the psychological $70,000 round number, which BTC has now lost as support. A reclaim of $70,000 would be the first bullish signal, while a breakdown below $68,677 could open the door to the $66,000–$67,000 zone. The lack of volume amplification during the sell-off is the only silver lining for bulls, but the trend remains firmly bearish until price reclaims the $72,000 level.
Ethereum Analysis
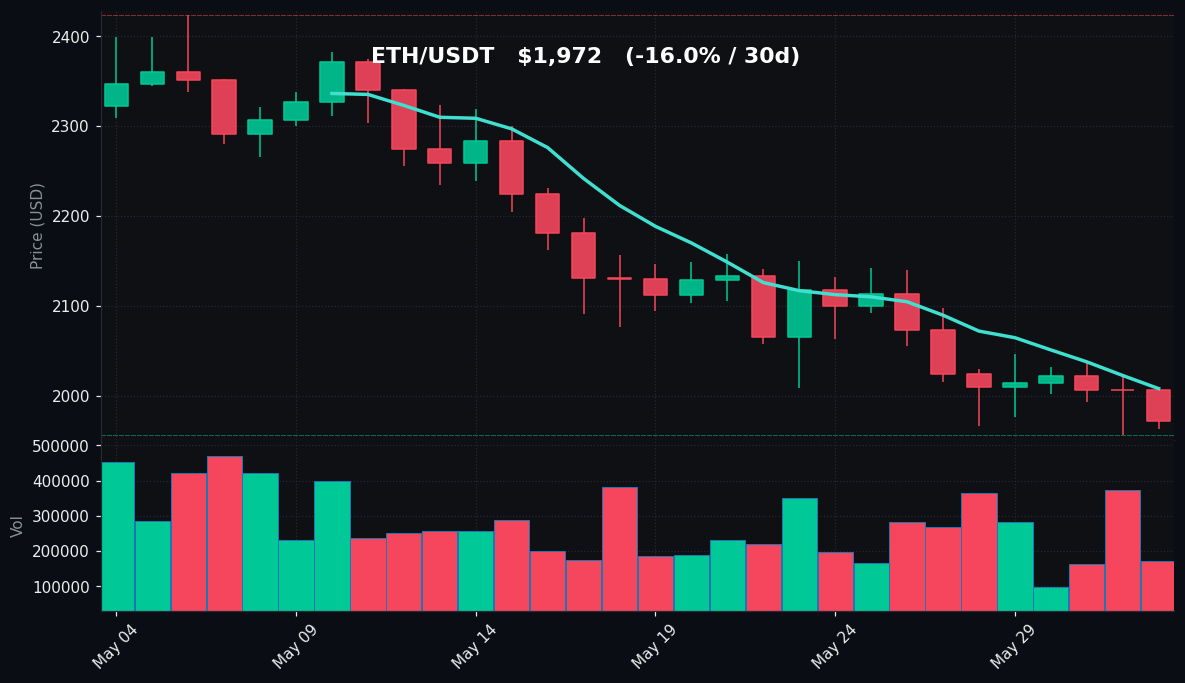
TradingView Live (4h)
Ethereum is showing slightly less aggressive selling pressure than Bitcoin in percentage terms, but its overall technical picture is equally concerning. ETH is trading at $1,972, down 1.74% on the day, with an intraday range of $1,963 to $2,007. The asset has now declined 15.99% over the past 30 days, underperforming Bitcoin's 13.98% decline during the same period.
ETH's moving average structure is bearish. The asset is trading below its MA7 of $2,008 and significantly below its MA30 of $2,169. The price is now 1.8% below the 7-day average and 9.1% below the 30-day average. The MA7 has been declining since May 27 and is now well below the MA30, which itself has started to flatten and turn downward. This moving average configuration is consistent with a bearish trend that has been in place for approximately three weeks.
The RSI(14) reading of 29.3 places ETH in oversold territory (below 30) for the first time in this downtrend. While not as extreme as Bitcoin's 21.2, an RSI below 30 still suggests that selling has been overdone in the short term. However, similar to BTC, the volume profile is concerning: trading volume is only 65% of the 7-day average, the lowest relative volume among the two assets. This indicates that the move lower is happening on thinning liquidity, which can lead to erratic price swings and potential for both sharp bounces and sudden drops.
ETH's 7-day high of $2,097 and 30-day high of $2,424 highlight the magnitude of the decline — the asset has lost over $450 from its monthly peak. The $1,963 intraday low is also the 30-day low, suggesting that ETH is testing fresh support levels. The $1,950–$2,000 zone has been a key area of interest over the past two months, and a sustained break below $1,950 would likely accelerate selling toward the $1,850–$1,900 region.
On the upside, the first resistance is the MA7 at $2,008, followed by the psychological $2,100 level. A close above $2,100 would be needed to suggest any meaningful reversal. For now, ETH remains in a downtrend with oversold conditions but no confirmation of a reversal pattern. The lower volume relative to BTC also suggests that ETH may be more susceptible to sudden volatility if large orders hit the order book.
Key Technical Levels
| Asset | Support | Resistance | RSI |
|---|---|---|---|
| BTC | $68,500 | $72,742 (MA7) | Oversold (21.2) |
| ETH | $1,950 | $2,008 (MA7) | Oversold (29.3) |
Notes on levels: BTC's immediate support is the 30-day low of $68,677, with a secondary support at $68,000 (round number). On the resistance side, the MA7 at $72,742 is the first hurdle, followed by $75,000 and the MA30 at $77,449. For ETH, support at $1,950 is critical; a break below could target $1,850. Resistance at $2,008 (MA7) is the first level, then $2,100 and the MA30 at $2,169.
BTC vs ETH Dynamic
The correlation between Bitcoin and Ethereum remains high, as both assets are experiencing synchronized selling pressure. However, there are nuances in their relative performance. Over the past 24 hours, ETH has outperformed BTC in percentage terms (down 1.74% vs. 3.79%), which is a reversal of the recent trend where Bitcoin was acting as the relative strength leader. On a 7-day basis, BTC's 9.52% decline is nearly double ETH's 4.92% drop, but over 30 days, ETH's 15.99% decline is worse. This suggests that while Bitcoin is experiencing a sharper short-term correction, Ethereum has been weakening more steadily over the longer timeframe. The RSI divergence is notable: BTC at 21.2 is more oversold than ETH at 29.3, implying that Bitcoin may be closer to a short-term exhaustion point. However, ETH's lower volume (0.65x vs. BTC's 0.92x) makes it more vulnerable to sudden moves. Both assets are trading below their respective moving averages, and no divergence pattern (such as ETH leading BTC higher) has emerged. The market remains in a risk-off mode where both assets are moving in lockstep, with no clear decoupling signals.
Strategy Fit
Given the current market conditions — deep oversold readings, declining volume, and prices below key moving averages — the most suitable trading strategies are those that account for high uncertainty and potential for mean reversion.
Grid trading is particularly well-suited for this environment. With BTC and ETH in oversold territory but without a confirmed reversal, a grid bot can capture profits from the expected range-bound movement between current support and resistance levels. For BTC, a grid between $68,000 and $72,000 would capture the immediate range, while for ETH, a grid between $1,950 and $2,050 would be appropriate. Pionex's spot grid bot allows users to set these ranges and automate buy-low-sell-high orders, which is ideal when the market is likely to oscillate within a defined range before establishing a new trend.
Dollar-cost averaging (DCA) is another viable approach for long-term holders. With both assets down 14-16% over the past month and RSI in oversold territory, accumulating at these levels through a DCA bot can reduce average entry price. Pionex's DCA bot allows users to set fixed intervals and amounts, which is particularly useful during volatile periods when timing the exact bottom is impossible.
Trend-following strategies are not recommended at this time, as both assets are in clear downtrends with no signs of reversal. Entering a trend-following long position would require a confirmed breakout above the MA7 and increasing volume, which are not present.
For more aggressive traders, a short-term mean reversion approach could be considered, but this carries significant risk given the low volume environment. Using Pionex's infinity grid or reverse grid bots for short positions is an option, but the oversold RSI readings suggest that the risk/reward for new shorts is unfavorable.
The optimal strategy is to use a combination of grid trading for immediate range profits and DCA for long-term accumulation, adjusting ranges and amounts as the market evolves.
Risk Disclaimer
This market recap is provided for informational and educational purposes only and does not constitute financial advice, investment recommendation, or solicitation to buy, sell, or hold any digital assets. Cryptocurrency markets are highly volatile and carry substantial risk, including the potential loss of principal. Past performance and technical indicators do not guarantee future results. The analysis presented is based on publicly available data and the author's interpretation, which may be incorrect or incomplete. Readers should conduct their own independent research and consult with a qualified financial advisor before making any investment decisions. The author and Pionex shall not be held liable for any losses or damages arising from the use of this information. Trading cryptocurrencies involves risk, and you should only invest what you can afford to lose.
FAQ
Q: Why is Bitcoin's RSI at 21.2 considered oversold, and what does that mean?
A: An RSI (Relative Strength Index) below 30 is traditionally considered oversold, indicating that the asset has been selling heavily and may be undervalued in the short term. A reading of 21.2 is deep oversold, suggesting that selling pressure has been extreme. Historically, such levels have often preceded short-term bounces, but they can also persist during prolonged downtrends. It is a signal to watch for potential reversal, not a guarantee.
Q: How reliable are the support and resistance levels listed in the report?
A: Support and resistance levels are based on recent price action, moving averages, and round numbers. The support at $68,500 for BTC is derived from the 30-day low and historical trading clusters. Resistance at $72,742 is the 7-day moving average. These levels are dynamic and can be broken, especially in low-volume conditions. They serve as reference points, not absolute boundaries.
Q: What does it mean when trading volume is below the 7-day average during a price decline?
A: Below-average volume during a decline suggests that the sell-off is not accompanied by panic selling or aggressive participation. It can indicate exhaustion of sellers or a lack of buyer interest. In oversold conditions, low-volume declines sometimes lead to sharp reversals if buyers step in, but they can also result in a slow grind lower if selling pressure persists.
Q: Is Ethereum's 30-day decline of 15.99% worse than Bitcoin's 13.98% decline?
A: Yes, in percentage terms, Ethereum has underperformed Bitcoin over the past 30 days. However, over the past 24 hours, Bitcoin has declined more sharply (3.79% vs. 1.74%). This suggests that while Ethereum has been weakening more steadily, Bitcoin is experiencing a sharper short-term correction. The relative performance can shift quickly.
Q: What trading strategies are most appropriate given the current market conditions?
A: Grid trading between support and resistance levels is suitable for capturing range-bound movements. Dollar-cost averaging (DCA) is appropriate for long-term accumulation at lower prices. Trend-following strategies are not recommended due to the clear downtrend. Short-term mean reversion carries high risk. Pionex offers automated bots for grid trading and DCA that can be tailored to current conditions.