BTC ETH Daily Recap — July 16, 2026

BTC ETH Daily Recap — July 16, 2026
Today at a Glance
Bitcoin and Ethereum showed contrasting performance on July 16, 2026, as BTC edged lower by 0.48% to $64,444, while ETH declined more sharply by 1.72% to $1,885. Despite the daily dip, both assets maintained positive weekly trajectories, with BTC up 1.92% and ETH posting a strong 8.01% gain over the past seven days. Bitcoin traded within a $1,160 range ($63,838–$64,998), while ETH oscillated between $1,868 and $1,929. Volume for both assets declined relative to their 7-day averages—BTC at 0.84x and ETH at 0.72x—suggesting reduced intraday participation. Technical indicators show BTC’s RSI at 62.8 (neutral-bullish) and ETH’s RSI at 70.9 (approaching overbought territory). Bitcoin remains above its 7-day and 30-day moving averages ($64,048 and $62,569), while ETH trades well above both its MA7 ($1,838) and MA30 ($1,722), reflecting sustained upward momentum in the altcoin leader.
Bitcoin Analysis
TradingView Live (4h)
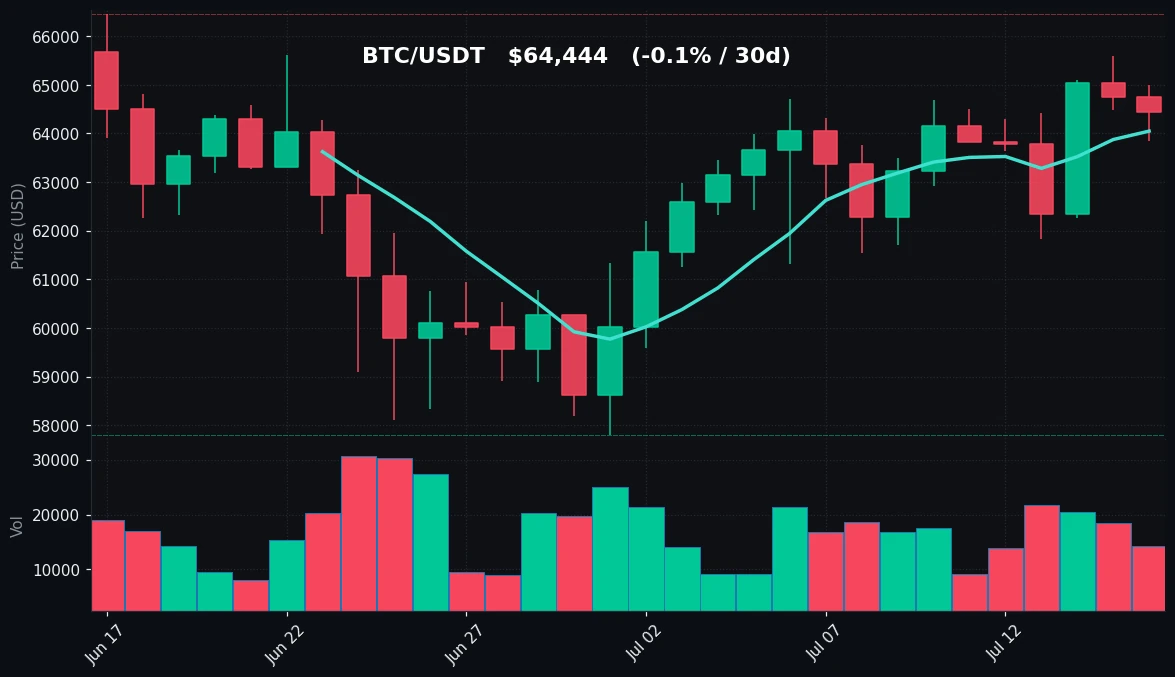
Bitcoin’s price action on July 16 reflects a modest pullback after testing resistance near the $65,000 level. The daily high of $64,998 was within striking distance of the psychological $65,000 mark, but sellers stepped in to cap further upside. The intraday low of $63,838 held above the 7-day moving average of $64,048, suggesting that short-term support remains intact. Over the past week, BTC established a range between $61,825 (7-day low) and $65,600 (7-day high), with the current price near the midpoint of that band.
The 30-day high of $66,446, recorded on June 16, remains the key overhead resistance zone. Bitcoin is currently trading $2,002 below that level, representing a 3.0% gap. The 30-day moving average at $62,569 continues to provide a solid floor, having been tested multiple times in late June when BTC dipped to $57,800. The current price is $1,875 above the MA30, indicating a healthy medium-term trend.
Volume analysis reveals a 16% decline compared to the 7-day average, suggesting that the daily move lacked strong conviction. This volume contraction during a slight pullback is typical in consolidation phases. The RSI(14) reading of 62.8 places Bitcoin in neutral territory, neither overbought nor oversold, leaving room for further upside without immediate exhaustion risk.
Key technical levels to watch include immediate support at $63,838 (daily low) followed by $63,000 (round number) and the MA7 at $64,048. On the upside, resistance sits at $64,998 (daily high), then $65,600 (7-day high), and ultimately $66,446 (30-day high). The absence of a clear breakout catalyst keeps BTC in a range-bound pattern, with the market awaiting directional cues from macroeconomic data or institutional flows.
Ethereum Analysis
TradingView Live (4h)
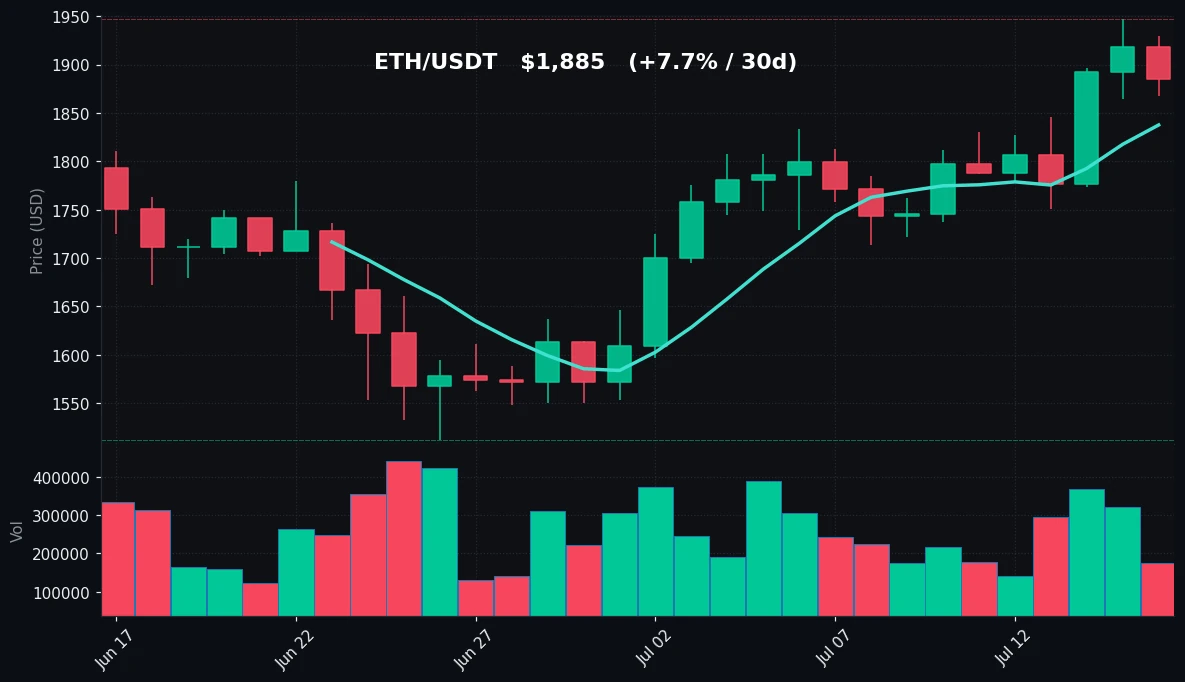
Ethereum’s 1.72% decline on July 16 marks a pause after an impressive 8.01% weekly gain—the strongest performance among major cryptocurrencies over the past seven days. The daily range of $1,868 to $1,929 shows ETH testing the $1,930 resistance zone twice in the past week (7-day high of $1,947), but failing to sustain above $1,900 on the daily close. The current price of $1,885 sits $13 below the daily high, reflecting intraday selling pressure.
Ethereum’s technical structure is notably bullish compared to Bitcoin. The 30-day moving average at $1,722 is well below the current price, representing a 9.5% premium. The 7-day moving average at $1,838 also acts as immediate support, with the price $47 above it. The 30-day low of $1,512, recorded on June 18, now appears distant as ETH has rallied 24.7% from that bottom. The 30-day high of $1,947 equals the 7-day high, indicating that ETH is testing multi-week resistance.
Volume on Ethereum was 28% below its 7-day average, suggesting that the daily decline occurred on relatively low participation. This could indicate profit-taking rather than aggressive selling. The RSI(14) of 70.9 is a critical data point—it sits just above the 70 threshold, traditionally considered overbought. While overbought readings can persist in strong uptrends, they often precede short-term pullbacks or consolidation.
Key support levels for ETH include $1,868 (daily low), $1,838 (MA7), and $1,722 (MA30). Resistance is clustered at $1,929 (daily high), $1,947 (7-day and 30-day high), and the psychological $2,000 round number. The proximity of RSI to overbought territory, combined with declining volume, suggests that ETH may need a consolidation phase before attempting another leg higher. The 8% weekly gain has already priced in significant bullish sentiment.
Key Technical Levels
| Asset | Support | Resistance | RSI |
|---|---|---|---|
| BTC | $63,838 (daily low), $63,000 (round), $62,569 (MA30) | $64,998 (daily high), $65,600 (7d high), $66,446 (30d high) | 62.8 — neutral-bullish |
| ETH | $1,868 (daily low), $1,838 (MA7), $1,722 (MA30) | $1,929 (daily high), $1,947 (7d/30d high), $2,000 (psychological) | 70.9 — overbought |
BTC vs ETH Dynamic
The correlation between Bitcoin and Ethereum remains high, but the magnitude of moves diverges notably. Over the past seven days, ETH has outperformed BTC by 609 basis points (8.01% vs 1.92%), continuing a trend where Ethereum leads in risk-on phases. On July 16, both assets declined, but ETH’s 1.72% drop was 3.6 times larger than BTC’s 0.48% decline, reflecting Ethereum’s higher beta. Bitcoin’s RSI at 62.8 suggests room for upside, while ETH’s 70.9 signals potential exhaustion. This divergence in momentum indicators often precedes a period of mean reversion, where either BTC catches up or ETH gives back gains. The volume ratio (ETH volume at 0.72x vs BTC at 0.84x of their respective 7-day averages) shows that Ethereum’s move attracted relatively less participation, hinting that the recent rally may be driven by thinner liquidity. Traders should monitor whether BTC can reclaim $65,000 to validate the broader uptrend, or if ETH’s overbought condition triggers a rotation back into Bitcoin.
Strategy Fit
Based on current market conditions—low intraday volume, neutral-to-overbought RSI readings, and price action consolidating near key levels—a grid trading strategy is most appropriate for both BTC and ETH. Bitcoin’s range-bound behavior between $63,800 and $65,600 over the past week creates an ideal environment for grid bots to capture small price oscillations. The relatively low volatility (daily range of ~1.8% for BTC) allows grids to operate with tight spreads and frequent fills.
For Ethereum, the overbought RSI (70.9) combined with declining volume suggests potential mean reversion. A short-term trend-following strategy using a trailing stop or a DCA (dollar-cost averaging) approach could be considered for those looking to accumulate on pullbacks. However, given ETH’s strong weekly performance, a grid bot with a neutral-to-bearish bias (e.g., setting the upper limit near $1,947 and lower limit near $1,838) may capture profit-taking moves.
Pionex’s built-in Infinity Grid or Leveraged Grid bots can automate these strategies without requiring manual order placement. For risk-averse participants, the DCA bot can systematically accumulate BTC or ETH at current levels, especially if the 30-day moving averages ($62,569 for BTC, $1,722 for ETH) are used as reference buy points. The current volume environment (below average for both assets) favors patience and automation over active trading.
Risk Disclaimer
This market recap is for informational and educational purposes only. It does not constitute financial advice, investment recommendations, or solicitation to buy or sell any cryptocurrency. Cryptocurrency markets are highly volatile and involve substantial risk of loss. Past performance does not guarantee future results. Technical indicators and levels are based on historical data and may not predict future price movements. Always conduct your own research and consult with a qualified financial advisor before making investment decisions. The author and publisher are not responsible for any financial losses incurred.
FAQ
Q: Why did Ethereum drop more than Bitcoin on July 16 despite its strong weekly performance?
A: Ethereum’s larger decline (1.72% vs BTC’s 0.48%) is typical of higher-beta assets. ETH had rallied 8.01% over the past week, pushing its RSI to 70.9 (overbought). Profit-taking after such gains, combined with lower volume (0.72x of 7-day average), often leads to sharper pullbacks in altcoins compared to Bitcoin.
Q: Is Bitcoin’s RSI of 62.8 bullish or bearish?
A: An RSI of 62.8 is neutral-bullish. It indicates that BTC has upward momentum but is not overbought (above 70). This leaves room for further gains without immediate exhaustion. Historically, BTC tends to trend well in the 55–70 RSI range.
Q: What does ETH’s overbought RSI (70.9) mean for short-term traders?
A: An RSI above 70 suggests ETH is overbought, meaning the recent rally may be extended. Short-term pullbacks or consolidation are common after such readings. However, overbought conditions can persist in strong uptrends, so traders should use additional confirmation like volume or price action before acting.
Q: How reliable are the support and resistance levels mentioned?
A: Support and resistance levels are based on recent price history (daily, 7-day, 30-day highs/lows) and moving averages. They are probabilistic, not guaranteed. In low-volume conditions like today (BTC volume at 0.84x average), levels may be more prone to false breaks. Always use stop-losses.
Q: What is the best trading strategy for low-volume days like July 16?
A: Low-volume days favor range-bound strategies like grid trading. For BTC, a grid between $63,800 and $65,000 captures the current consolidation. For ETH, a grid between $1,840 and $1,940 works. Avoid trend-following strategies when volume is below average, as breakouts often lack conviction.


