BTC ETH Daily Recap – July 20, 2026

BTC ETH Daily Recap – July 20, 2026
Today at a Glance
On July 20, 2026, the crypto market exhibited a mild pullback after a mostly positive weekly performance. Bitcoin (BTC) traded at $64,372, down 0.54% in the last 24 hours, with an intraday range between $63,100 and $65,108. Despite the daily decline, BTC’s 7-day change remains positive at +3.27%, and its 30-day performance shows a modest +1.67%. The asset is hovering near its 7-day moving average ($64,499), with the 30-day MA ($62,633) acting as solid support. Ethereum (ETH) followed a similar pattern, trading at $1,864, down 0.42% daily, but with stronger medium-term momentum: +4.93% over 7 days and +9.22% over 30 days. ETH’s 7-day high of $1,947 marks a key resistance level, while its 30-day low of $1,512 underscores a significant recovery. Trading volumes for both assets are below their 7-day averages—BTC at 0.82x and ETH at 0.62x—suggesting reduced speculative activity. The RSI(14) for BTC sits at 51.5 (neutral), while ETH’s at 57.7 (slightly bullish). Overall, the market is consolidating gains, with BTC testing near-term resistance and ETH showing relative strength.
Bitcoin Analysis
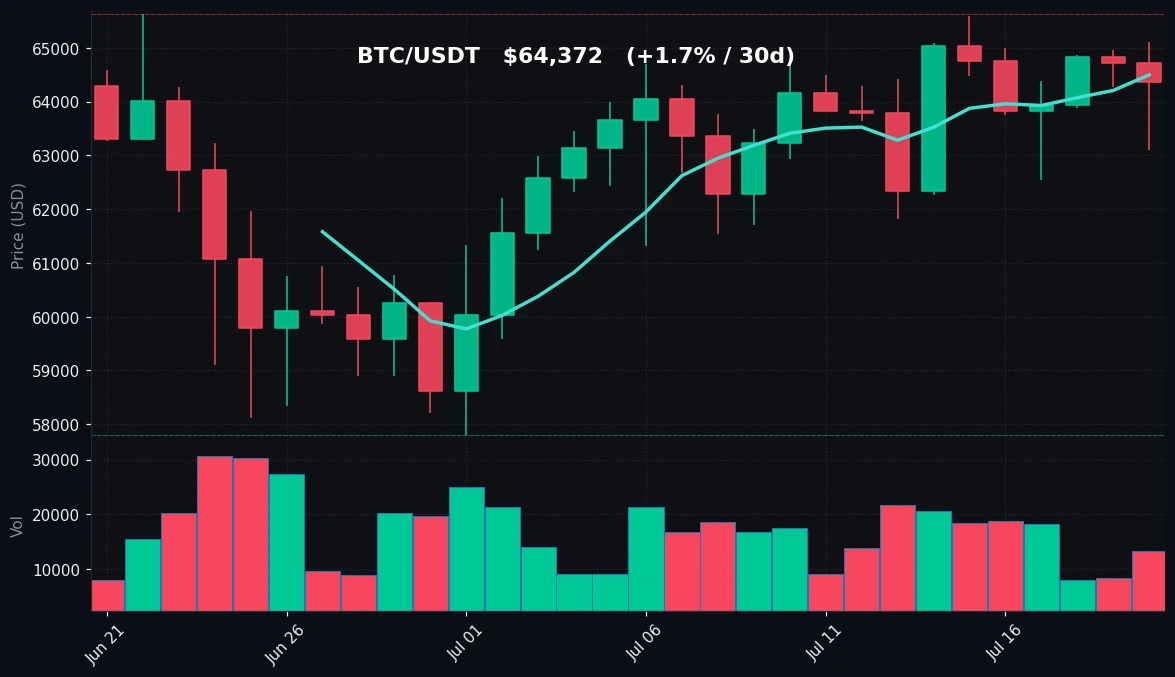
TradingView Live (4h)
Bitcoin is currently trading at $64,372, positioned just below its 7-day moving average of $64,499. The daily decline of 0.54% is modest, but the intraday low of $63,100 indicates that sellers are testing support near the $63,000 zone. The 7-day high of $65,600 and the 30-day high of $65,623 form a clear resistance cluster around $65,600–$65,623. A break above this level would be significant, but the current price action suggests indecision.
Technically, BTC’s RSI(14) at 51.5 is firmly in neutral territory, indicating no overbought or oversold conditions. This neutral reading aligns with the consolidation phase, as neither bulls nor bears have seized control. The 30-day moving average at $62,633 continues to provide a solid floor, having been tested multiple times over the past month. The 7-day MA at $64,499 is acting as immediate resistance, with the price oscillating around it.
Volume is a key concern: the current trading volume is only 0.82x the 7-day average, suggesting a lack of conviction. Lower volume during a consolidation phase often precedes a breakout, but the direction remains uncertain. The 30-day low of $57,800 represents a major support level, but it is far from current prices. The immediate support zone is $63,000–$63,100, where the intraday low was set. If BTC breaks below $63,000, the next support is at $62,272 (7-day low) and then $62,633 (30-day MA).
The price action over the past 7 days shows a gradual uptrend from $62,272 to $65,600, followed by a slight pullback. This is typical of a healthy correction within an uptrend. However, the failure to hold above the 7-day MA suggests that momentum is waning. The neutral RSI and below-average volume point to a market that is waiting for a catalyst—either a macroeconomic event or a shift in sentiment.
Key levels to watch: resistance at $65,600 (7-day high) and $65,623 (30-day high); support at $63,100 (intraday low) and $62,633 (30-day MA). The $64,000 round number is also psychological support. Without a volume spike, BTC is likely to remain range-bound between $63,000 and $65,600 in the near term.
Ethereum Analysis
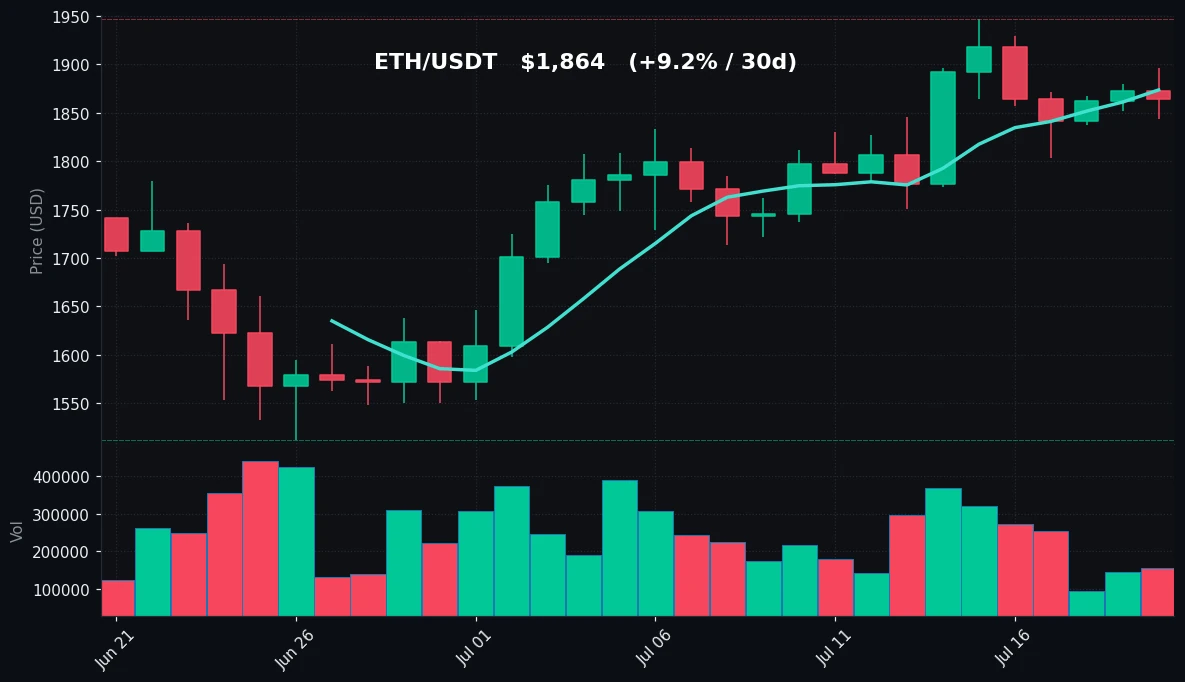
TradingView Live (4h)
Ethereum is trading at $1,864, down 0.42% on the day, but with a stronger weekly and monthly performance than Bitcoin. The 7-day gain of +4.93% and 30-day gain of +9.22% highlight ETH’s relative strength. The intraday high of $1,896 and low of $1,843 show that ETH is consolidating near the upper end of its recent range.
Technically, ETH’s RSI(14) at 57.7 is in the slightly bullish zone, above the neutral 50 level but not yet overbought (typically 70+). This suggests that upward momentum is present but not excessive. The 7-day moving average at $1,874 is acting as immediate resistance, with the price trading slightly below it. The 30-day moving average at $1,739 is well below current prices, indicating a strong medium-term uptrend.
The 7-day high of $1,947 and 30-day high of $1,947 form a critical resistance level. A break above $1,947 would be a bullish signal, potentially opening the path to $2,000 psychological resistance. On the downside, support is at $1,843 (intraday low), $1,773 (7-day low), and $1,739 (30-day MA). The 30-day low of $1,512 represents a major support floor, but it is far from current levels.
Volume is notably low at 0.62x the 7-day average, even lower than BTC’s relative volume. This suggests that the recent upward move in ETH may be driven by low liquidity, making it susceptible to sharp moves in either direction. The consolidation between $1,843 and $1,896 is tight, and a breakout above $1,896 (intraday high) could quickly test $1,947.
ETH’s outperformance relative to BTC is notable: over 7 days, ETH gained 4.93% vs BTC’s 3.27%; over 30 days, ETH gained 9.22% vs BTC’s 1.67%. This divergence suggests that capital may be rotating from BTC to ETH, or that ETH-specific catalysts (such as network upgrades or DeFi activity) are driving demand. The RSI divergence—ETH at 57.7 vs BTC at 51.5—confirms that ETH has stronger short-term momentum.
Key levels: resistance at $1,896 (intraday high) and $1,947 (7d/30d high); support at $1,843 (intraday low) and $1,773 (7d low). The $1,800 round number is also psychological support. Given the low volume, traders should be cautious of false breakouts.
Key Technical Levels
| Asset | Support | Resistance | RSI |
|---|---|---|---|
| BTC | $63,100 / $62,633 | $65,600 / $65,623 | 51.5 – Neutral |
| ETH | $1,843 / $1,773 | $1,896 / $1,947 | 57.7 – Slightly Bullish |
BTC vs ETH Dynamic
The correlation between BTC and ETH remains strong in the short term, as both assets experienced a mild daily decline after a positive weekly performance. However, the magnitude of the moves differs: BTC’s 7-day gain of 3.27% is significantly lower than ETH’s 4.93%, and the 30-day divergence is even more pronounced (BTC +1.67% vs ETH +9.22%). This suggests that ETH is currently the outperformer, likely driven by sector-specific factors such as increased DeFi activity, staking yields, or anticipation of network upgrades. The RSI differential (BTC 51.5 vs ETH 57.7) confirms that ETH has stronger momentum. In terms of volatility, ETH’s wider percentage swings (7-day range: $1,773–$1,947, or 9.8% range) compared to BTC’s (7-day range: $62,272–$65,600, or 5.3% range) indicate that ETH is the more volatile asset. For traders, this means ETH offers higher potential returns but also higher risk. The low volume on both assets suggests that the current divergence may be a result of thin liquidity rather than fundamental shifts. If BTC breaks above $65,600, it could drag ETH higher; conversely, a BTC breakdown below $63,000 could lead to ETH testing $1,773 support.
Strategy Fit
Given the current market conditions—neutral RSI for BTC, slightly bullish RSI for ETH, low volume, and tight consolidation ranges—the most suitable strategies are those that capitalize on range-bound movements without directional bets.
Grid Trading is highly appropriate for both BTC and ETH in the current environment. BTC is oscillating between $63,100 and $65,600, while ETH is between $1,843 and $1,896. A grid bot that places buy and sell orders within these ranges can profit from the volatility without predicting direction. Pionex offers built-in grid trading bots that automatically execute this strategy. For BTC, a grid with upper limit at $65,600 and lower limit at $63,100, with 10–20 grids, could capture the 3.9% range. For ETH, a grid between $1,843 and $1,896 (2.9% range) with 10 grids is suitable.
DCA (Dollar-Cost Averaging) is also viable, especially given the neutral RSI and consolidation. DCA reduces timing risk and is ideal for long-term accumulation. Pionex’s DCA bot allows users to set fixed intervals (e.g., daily or weekly) to buy BTC and ETH. Given the 30-day uptrend (BTC +1.67%, ETH +9.22%), DCA has been profitable over the past month. However, the low volume suggests that the trend may be fragile, so DCA should be combined with a stop-loss or adjusted position sizes.
Trend Following is less appropriate today because neither asset is in a clear trend. BTC’s RSI is neutral, and ETH’s RSI is only slightly bullish. Trend-following strategies (e.g., moving average crossovers) would have generated signals, but the low volume increases the risk of false breakouts. If ETH breaks above $1,947 with volume, a trend-following strategy could be activated.
For risk-averse traders, a stablecoin savings strategy (e.g., Pionex’s savings bot) may be preferable until a clear trend emerges. For active traders, grid trading on Pionex offers a low-risk way to profit from the current range.
Risk Disclaimer
This market recap is for informational and educational purposes only. It does not constitute financial advice, investment recommendations, or trading signals. Cryptocurrency markets are highly volatile and involve substantial risk of loss. Past performance is not indicative of future results. The technical analysis, strategy suggestions, and key levels discussed are based on current data and may change rapidly. Always conduct your own research (DYOR) and consult with a qualified financial advisor before making any investment decisions. The use of automated trading bots, including those on Pionex, does not guarantee profits and may result in losses. Never invest more than you can afford to lose.
FAQ
Q: Why is Bitcoin consolidating near $64,000 despite the weekly gain?
A: Bitcoin’s consolidation near $64,000 reflects a period of indecision after a 3.27% weekly gain. The RSI at 51.5 is neutral, and trading volume is 18% below the 7-day average, indicating reduced participation. The asset is testing resistance at its 7-day moving average ($64,499) while support at $63,100 holds. This is typical of a market waiting for a catalyst, such as macroeconomic news or a breakout above the $65,600 resistance.
Q: Is Ethereum outperforming Bitcoin, and if so, why?
A: Yes, Ethereum is outperforming Bitcoin over both 7-day (+4.93% vs +3.27%) and 30-day (+9.22% vs +1.67%) periods. This divergence may be due to ETH-specific factors such as increased DeFi activity, staking demand, or anticipation of network upgrades. The RSI(14) of 57.7 (vs BTC’s 51.5) confirms stronger momentum. However, low volume (0.62x average) suggests the move may be liquidity-driven, so caution is warranted.
Q: What are the key support and resistance levels for BTC and ETH?
A: For Bitcoin, immediate support is at $63,100 (intraday low) and $62,633 (30-day moving average). Resistance is at $65,600 (7-day high) and $65,623 (30-day high). For Ethereum, support is at $1,843 (intraday low) and $1,773 (7-day low). Resistance is at $1,896 (intraday high) and $1,947 (7-day and 30-day high). A break above or below these levels could signal the next trend.
Q: Which trading strategy is best suited for current market conditions?
A: Grid trading is most suitable due to the range-bound price action. For BTC, a grid between $63,100 and $65,600 can capture the 3.9% range. For ETH, a grid between $1,843 and $1,896 captures the 2.9% range. Pionex’s built-in grid bot automates this strategy. DCA is also viable for long-term accumulation, while trend following is not recommended until a clear breakout occurs.
Q: What does the low trading volume indicate?
A: Low trading volume (BTC at 0.82x average, ETH at 0.62x average) indicates reduced market participation and liquidity. This can lead to sharp price movements on low volume, making the market susceptible to manipulation or sudden volatility spikes. It also suggests that the recent price trends may not be sustainable without increased volume. Traders should use tighter stop-losses and avoid large positions until volume normalizes.


