BTC ETH Daily Recap — July 22, 2026

BTC ETH Daily Recap — July 22, 2026
Today at a Glance
The crypto market on July 22, 2026, showed mixed momentum, with Bitcoin edging lower while Ethereum posted modest gains. Bitcoin (BTC) traded at $65,911, down 0.97% over the past 24 hours, after touching a daily high of $66,740 and a low of $65,554. The weekly performance remains positive at +1.78%, with a seven-day range of $62,538 to $66,956. Ethereum (ETH) rose 0.46% to $1,939, with a daily high of $1,945 and low of $1,911. ETH’s 30-day performance is notably stronger at +16.30%, compared to BTC’s +5.06%. Volume across both assets is below their seven-day averages—BTC at 0.85x and ETH at 0.61x—suggesting cautious participation. BTC’s RSI(14) sits at 66.1, approaching overbought territory, while ETH’s RSI(14) at 73.0 indicates stronger bullish momentum. The divergence in short-term price action and RSI levels highlights a market where Bitcoin consolidates near resistance while Ethereum continues its upward trajectory.
Bitcoin Analysis
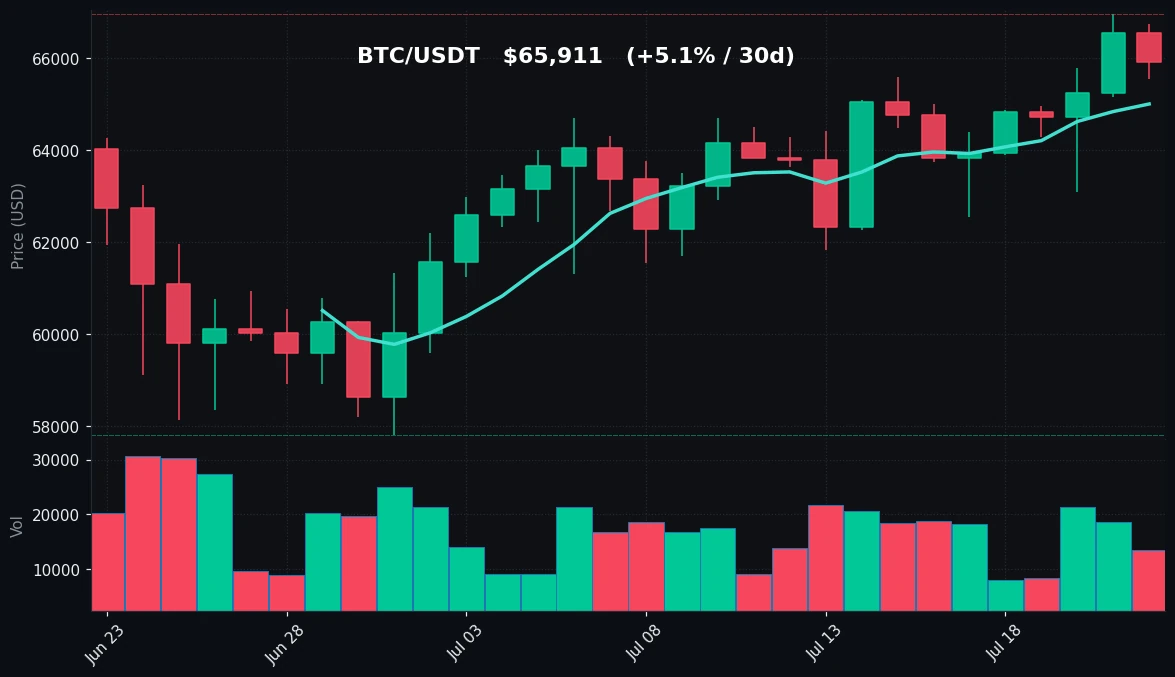
TradingView Live (4h)
Bitcoin’s price action on July 22 reflects a modest pullback from recent highs, with the asset trading at $65,911, down 0.97% in the last 24 hours. The daily range of $65,554 to $66,740 indicates a relatively narrow trading band, suggesting indecision among market participants. Despite the intraday decline, Bitcoin’s weekly performance remains positive at +1.78%, with the seven-day high of $66,956 only 1.6% above the current price. The 30-day trend is also bullish, with a gain of +5.06% and a 30-day range from $57,800 to $66,956, placing the current price near the top of that range.
Key technical levels provide context for the current position. The 7-day moving average (MA7) at $65,006 is below the current price, confirming short-term bullish momentum. The 30-day moving average (MA30) at $62,834 is significantly lower, reinforcing the medium-term uptrend. However, the price is now trading just 1.4% above the MA7, suggesting that the immediate support level is being tested. The RSI(14) at 66.1 is in neutral-to-bullish territory but not yet overbought (above 70), leaving room for further upside if buying pressure resumes.
Volume analysis reveals a contraction in activity. The current volume is only 0.85 times the seven-day average, indicating lower participation compared to the recent weekly norm. This volume decline during a pullback is typical of consolidation phases, where sellers are not aggressive enough to trigger a sharp decline, but buyers are also absent. The lack of volume confirmation for the recent price rise from the 30-day low of $57,800 to the current level suggests that the move may require a catalyst to sustain momentum.
Support levels to watch include the MA7 at $65,006, followed by the psychological $64,000 mark and the MA30 at $62,834. On the upside, resistance is at the seven-day high of $66,956, followed by the $67,000 round number and the 30-day high of $66,956. The proximity of the current price to both support and resistance suggests that a breakout or breakdown could occur with a volume surge. The RSI’s position at 66.1, approaching overbought but not yet there, leaves the market in a neutral-to-bullish stance, pending volume confirmation.
Ethereum Analysis
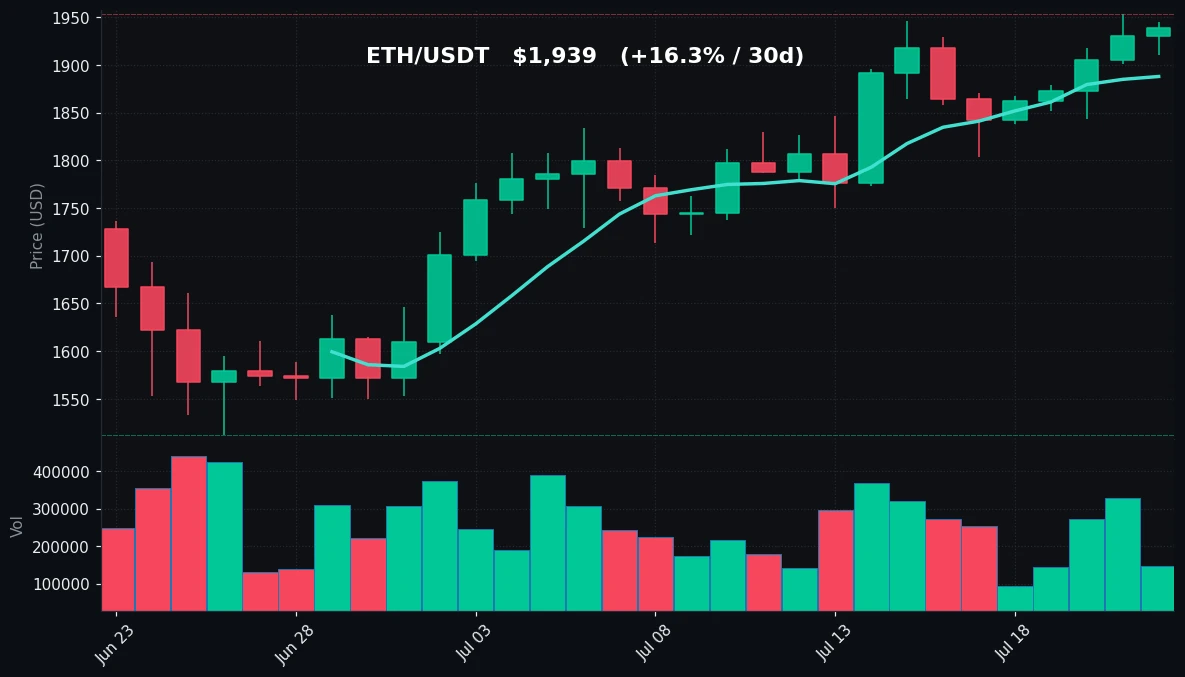
TradingView Live (4h)
Ethereum’s performance on July 22 stands in contrast to Bitcoin, with a modest 0.46% gain to $1,939. The daily range of $1,911 to $1,945 is narrow, indicating low volatility, but the weekly and monthly trends are decisively bullish. Over the past seven days, ETH has gained 1.10%, with a high of $1,953 and a low of $1,803. The 30-day performance is particularly notable, with a 16.30% increase from a low of $1,512 to the current price—a rally of over 28% from the monthly trough.
Technical indicators strongly support the bullish narrative. The MA7 at $1,888 is well below the current price, while the MA30 at $1,755 is significantly lower, confirming a sustained uptrend. The price is trading 2.7% above the MA7 and 10.5% above the MA30, indicating strong momentum. The RSI(14) at 73.0 is in overbought territory (above 70), which typically signals that the asset may be due for a pullback or consolidation. However, in strong trends, overbought readings can persist, and the RSI does not necessarily predict an immediate reversal.
Volume analysis provides a cautionary note. Ethereum’s current volume is only 0.61 times its seven-day average, a significant decline. This volume contraction during a price rise suggests that the rally may be driven by lower conviction, potentially making it vulnerable to profit-taking. The 30-day high of $1,953 is only 0.7% above the current price, meaning ETH is testing a key resistance level with declining volume—a classic setup for a potential reversal or consolidation.
Support levels for ETH include the MA7 at $1,888, followed by the $1,850 round number and the MA30 at $1,755. On the resistance side, the immediate hurdle is the 30-day high of $1,953, followed by the psychological $2,000 level. The overbought RSI at 73.0, combined with declining volume, suggests that traders should monitor for a potential pullback toward the MA7 or lower. However, the strong 30-day trend (16.30% gain) indicates that any dip could attract buyers, as the medium-term outlook remains positive.
Key Technical Levels
| Asset | Support | Resistance | RSI |
|---|---|---|---|
| BTC | $65,006 (MA7), $64,000, $62,834 (MA30) | $66,956 (7d/30d high), $67,000 | 66.1 (neutral) |
| ETH | $1,888 (MA7), $1,850, $1,755 (MA30) | $1,953 (7d/30d high), $2,000 | 73.0 (overbought) |
BTC vs ETH Dynamic
Bitcoin and Ethereum are displaying diverging short-term momentum, with BTC declining 0.97% while ETH gains 0.46% on the day. However, their weekly performances are aligned (+1.78% for BTC, +1.10% for ETH), and both have positive 30-day trends. The correlation between the two assets remains high, as both are influenced by broader market sentiment, but the divergence in RSI—BTC at 66.1 (neutral) versus ETH at 73.0 (overbought)—suggests that ETH is leading the move while BTC consolidates. Historically, when BTC consolidates near resistance and ETH continues to rise, it can signal a shift in market leadership toward altcoins. However, ETH’s declining volume relative to its seven-day average (0.61x) compared to BTC’s (0.85x) indicates that ETH’s move may be less supported, potentially leading to a convergence in the coming days.
Strategy Fit
Based on current volatility and technical conditions, the market environment favors a combination of trend-following and mean-reversion strategies. Bitcoin’s low volume and narrow range near support suggest a consolidation phase, making grid trading a suitable approach. A grid bot on BTC/USDT around the $65,000 to $67,000 range can capture profits from small price oscillations without directional bias. Ethereum’s overbought RSI and declining volume indicate potential for a pullback, so a DCA (dollar-cost averaging) strategy for ETH accumulation on dips below the MA7 ($1,888) could be prudent. For trend-following, a trailing stop or moving average crossover strategy on the daily timeframe may work for ETH, given its strong 30-day trend. Pionex’s built-in grid trading bots and DCA bots are well-suited for these conditions, allowing automated execution of these strategies without manual intervention. The low volume environment suggests that high-frequency trading strategies may face slippage, making passive approaches like grid or DCA more appropriate.
Risk Disclaimer
This market recap is for informational and educational purposes only and does not constitute financial advice, investment recommendation, or solicitation to buy or sell any crypto assets. Cryptocurrency markets are highly volatile and involve substantial risk, including the potential loss of principal. Past performance is not indicative of future results. Technical indicators and levels are based on historical data and may not predict future price movements. Readers should conduct their own research and consult with a qualified financial advisor before making any investment decisions. The author and publisher are not responsible for any losses or damages arising from the use of this information.
FAQ
Q: Why is Ethereum’s RSI overbought while Bitcoin’s is neutral?
A: Ethereum’s RSI of 73.0 reflects its stronger 30-day performance (+16.30%) compared to Bitcoin’s +5.06%, with ETH rallying from a 30-day low of $1,512 to $1,939. Bitcoin’s RSI of 66.1 indicates it has not yet reached the same level of momentum, partly due to its more gradual recovery from $57,800 to $65,911.
Q: What does the volume decline relative to the 7-day average mean?
A: Both BTC and ETH are trading with volume below their seven-day averages (BTC 0.85x, ETH 0.61x). This suggests lower market participation, which can lead to false breakouts or increased volatility. Low volume during a price rise (as with ETH) may indicate weak conviction, while low volume during a pullback (as with BTC) can signal consolidation.
Q: What are the key support and resistance levels for BTC and ETH today?
A: For BTC, immediate support is at the MA7 of $65,006, with stronger support at $62,834 (MA30). Resistance is at the seven-day high of $66,956 and $67,000. For ETH, support is at the MA7 of $1,888, followed by $1,755 (MA30). Resistance is at $1,953 (7d/30d high) and the psychological $2,000 level.
Q: How do the 7-day and 30-day moving averages help in analysis?
A: The MA7 reflects short-term momentum, while the MA30 indicates medium-term trend. When price is above both, it confirms an uptrend. The distance between price and these MAs shows trend strength—ETH is 2.7% above MA7 and 10.5% above MA30, indicating a stronger trend than BTC, which is 1.4% above MA7 and 4.9% above MA30.
Q: What strategies are suitable for the current market conditions?
A: Given low volume and narrow ranges, grid trading (e.g., Pionex grid bot) around BTC’s $65,000-$67,000 range can capture small profits. For ETH, a DCA strategy on dips below the MA7 of $1,888 may be appropriate due to overbought RSI. Trend-following strategies can work for ETH on the daily timeframe, but caution is warranted due to declining volume.


