BTC ETH Daily Recap – July 26, 2026

BTC ETH Daily Recap – July 26, 2026
Today at a Glance
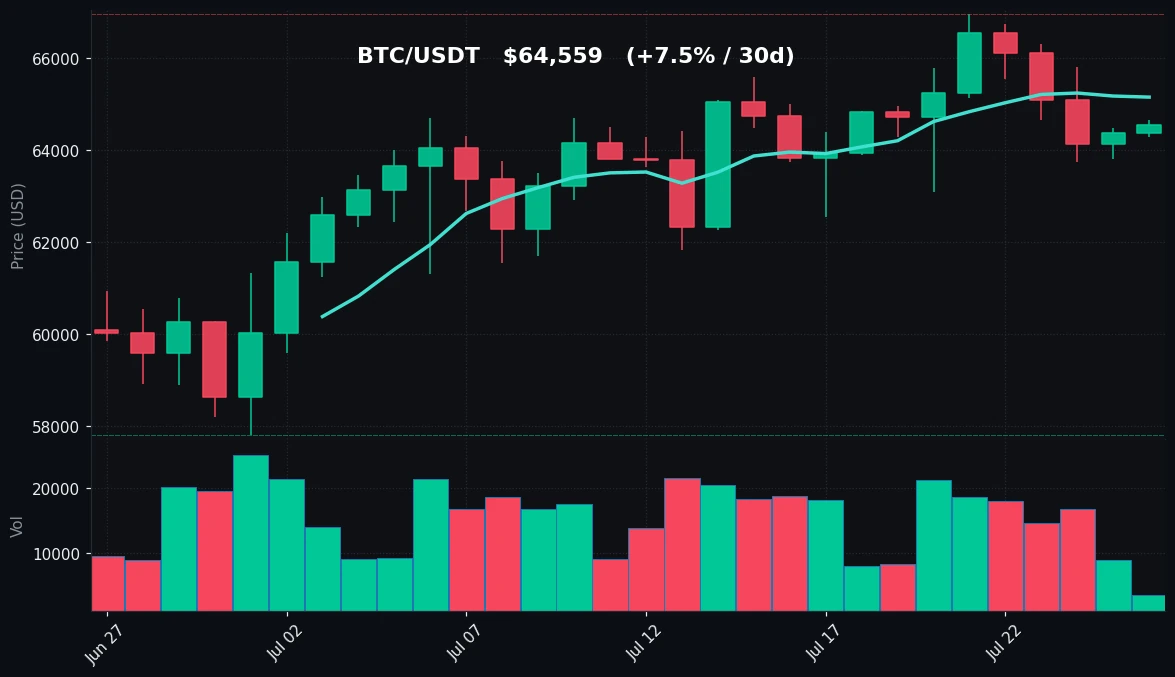
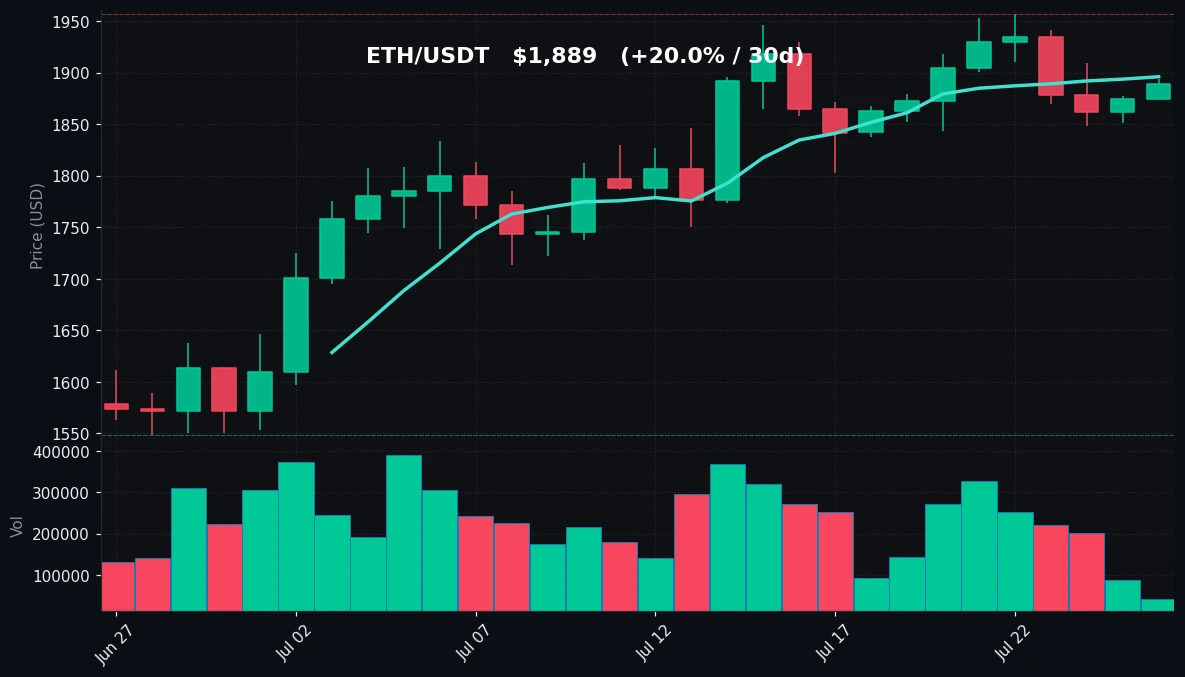
The crypto market on July 26, 2026, shows a muted but steady session, with Bitcoin (BTC) and Ethereum (ETH) both posting modest intraday gains. BTC/USDT is trading at $64,559, up 0.29% in the last 24 hours, with a tight range between $64,294 and $64,663. The 7-day trend remains slightly negative at -0.25%, while the 30-day performance is positive at +7.55%, suggesting a consolidation phase after a broader recovery from the 30-day low of $57,800. Ethereum outperforms Bitcoin on the day, rising 0.73% to $1,889, with a stronger 7-day gain of +0.87% and an impressive 30-day return of +19.98%. ETH’s 30-day high of $1,956 marks a 26.4% rally from its low of $1,548. Trading volumes are notably subdued for both assets, with BTC volume at 0.23x the 7-day average and ETH at 0.20x, indicating low participation and a potential wait-and-see sentiment among traders. The RSI(14) for BTC sits at 53.5 (neutral), while ETH’s RSI at 59.3 leans slightly bullish but not overbought. Both assets are trading near their 7-day moving averages, with BTC just below its MA7 of $65,157 and ETH slightly below its MA7 of $1,896. The market appears to be in a balanced state, with no clear directional bias emerging from today’s data.
Bitcoin Analysis
TradingView Live (4h)
Bitcoin’s price action on July 26, 2026, reflects a market in a holding pattern. The asset opened near $64,350 and edged higher to a session high of $64,663 before settling at $64,559. The intraday low of $64,294 was only $265 below the current price, illustrating a compressed range that signals indecision among market participants. Over the past week, BTC has been oscillating between a high of $66,956 and a low of $63,100, with the current price positioned near the middle of this band. The 7-day moving average at $65,157 sits slightly above the current price, suggesting mild short-term bearish pressure, but the 30-day MA at $63,323 remains well below, indicating that the broader trend is still upward from the 30-day perspective.
The RSI(14) reading of 53.5 is firmly in neutral territory, neither overbought nor oversold. This aligns with the lack of momentum seen in the price action. Historically, RSI around 50 often precedes a period of consolidation or a gradual trend development, but no directional signal is present today. The volume data is particularly telling: current trading volume is only 23% of the 7-day average. This significant drop in participation suggests that institutional and retail traders are largely on the sidelines, possibly awaiting clearer macroeconomic cues or a breakout from the current range. Low volume during a price consolidation can sometimes precede a volatile move, but it is equally consistent with a market that is simply “resting” after the 30-day rally from $57,800.
Key technical levels to watch include the immediate resistance at the 7-day high of $66,956, which also coincides with the 30-day high. A break above this level would signal renewed bullish momentum. On the downside, support is found at the 30-day MA of $63,323, followed by the 7-day low of $63,100. A failure to hold these levels could open the door to a retest of the $57,800 low from 30 days ago. The Bollinger Bands (not provided in data but implied by range) would likely be contracting, reflecting the low volatility environment. For now, Bitcoin remains in a neutral technical posture, with no clear catalyst to break the stalemate.
Ethereum Analysis
TradingView Live (4h)
Ethereum’s performance today shows slightly more bullish undertones compared to Bitcoin, though the overall picture remains one of low activity. ETH/USDT is trading at $1,889, up 0.73% from the previous close. The intraday range was narrow, from $1,874 to $1,894, a mere $20 spread. This tight consolidation comes after a strong 30-day performance, where ETH rallied 19.98% from a low of $1,548 to a high of $1,956. The current price is $67 below the 7-day high of $1,956, suggesting that the recent peak may be acting as a resistance level.
The 7-day moving average at $1,896 is just $7 above the current price, indicating that ETH is essentially testing this short-term trend line. The 30-day MA at $1,791 provides a solid support level about 5.2% below the current price. The RSI(14) of 59.3 is in the upper-neutral zone, closer to overbought territory (typically 70+) but not yet signaling exhaustion. This reading suggests that buying pressure has been moderate but sustained over the last two weeks, with no extreme positioning. The volume, however, is a concern: at only 20% of the 7-day average, the rally in ETH over the past month has occurred on declining participation. This divergence between price and volume can sometimes indicate that the move is driven by spot buying rather than speculative leverage, but it also makes the rally more susceptible to sudden reversals if sentiment shifts.
Key technical levels for ETH are clear: resistance at the 7-day and 30-day high of $1,956. A break above this level would confirm the continuation of the uptrend and could target the psychological $2,000 mark. On the downside, immediate support is at the 7-day MA of $1,896, followed by the 30-day MA at $1,791. The 7-day low of $1,843 serves as an intermediate support. The RSI not being overbought leaves room for further upside, but the low volume suggests that a catalyst—such as network upgrades, DeFi activity, or broader market news—may be needed to break the current equilibrium. Ethereum’s relative strength against Bitcoin (ETH/BTC pair) has been improving, which is a positive sign for altcoin sentiment.
Key Technical Levels
| Asset | Support | Resistance | RSI |
|---|---|---|---|
| BTC | $63,100 / $63,323 | $66,956 | Neutral (53.5) |
| ETH | $1,843 / $1,791 | $1,956 | Neutral-Bullish (59.3) |
BTC vs ETH Dynamic
The correlation between Bitcoin and Ethereum remains high, as both assets are trading in narrow ranges with subdued volumes. However, a subtle divergence is emerging: Ethereum’s 30-day return of +19.98% significantly outpaces Bitcoin’s +7.55%, indicating that ETH is leading the recovery from the recent lows. This is often a sign of “altcoin season” dynamics, where capital rotates from BTC into larger-cap altcoins like ETH. The ETH/BTC ratio (not explicitly provided but calculable at approximately 0.0293) has been trending higher, suggesting that Ethereum is gaining relative strength. In today’s session, ETH’s 0.73% gain also outperformed BTC’s 0.29% gain, continuing this trend. The RSI differential (59.3 for ETH vs 53.5 for BTC) further supports the view that Ethereum has slightly more momentum. That said, both assets remain in a low-volatility environment, and a decisive move in Bitcoin would likely dictate the direction for Ethereum as well.
Strategy Fit
Given the current market conditions—low volatility, neutral RSI, and reduced volume—the most suitable trading strategies are those that capitalize on range-bound movement or accumulate positions for a potential breakout. Grid trading is particularly well-suited for this environment. With BTC oscillating between $63,100 and $66,956, and ETH between $1,843 and $1,956, a grid bot can profit from the small price fluctuations within these ranges. Pionex’s built-in grid trading bots allow users to set upper and lower price bounds and automatically execute buy-low/sell-high orders, capturing profits from each minor swing. This strategy thrives in sideways markets with low volatility.
For traders with a longer time horizon, Dollar-Cost Averaging (DCA) is also appropriate. The 30-day trend is positive for both assets, and the current prices are below the 30-day highs. A DCA bot, such as Pionex’s automated DCA tool, can systematically accumulate BTC and ETH at regular intervals, smoothing out entry points and reducing the impact of any short-term dips. This approach is less reliant on timing the market and more aligned with the gradual upward bias seen in the 30-day data.
Trend-following strategies are less advisable today, as the RSI and volume do not confirm a strong directional move. A breakout above $66,956 for BTC or $1,956 for ETH would be a trigger to switch to trend-following bots, but until then, range-bound strategies are preferred. Pionex also offers leveraged grid bots for those seeking higher returns, but given the low volume, caution is warranted. Overall, the market today favors patience and automation over active speculation.
Risk Disclaimer
This market recap is for informational and educational purposes only and does not constitute financial advice, investment recommendation, or solicitation to buy or sell any assets. Cryptocurrency markets are highly volatile and involve substantial risk, including the potential loss of principal. Past performance is not indicative of future results. The data and analysis presented are based on publicly available information as of July 26, 2026, and may contain errors or omissions. Always conduct your own research (DYOR) and consult with a qualified financial advisor before making any investment decisions. The use of automated trading bots, including those offered by Pionex, does not guarantee profits and may amplify losses in adverse market conditions. Trade responsibly.
FAQ
Q: Why is trading volume so low for both BTC and ETH today?
A: Trading volume is at 0.23x and 0.20x the 7-day average for BTC and ETH, respectively. This suggests reduced market participation, possibly due to a lack of major news, weekend effect (if applicable), or traders waiting for a breakout from the current range. Low volume often precedes increased volatility, but the direction is uncertain.
Q: What does a neutral RSI of 53.5 for BTC mean for traders?
A: An RSI of 53.5 indicates that Bitcoin is neither overbought nor oversold, meaning the market is in equilibrium. Traders should not expect an immediate reversal or breakout based on RSI alone. It supports a range-bound or consolidation scenario.
Q: Is Ethereum’s 19.98% 30-day gain sustainable?
A: The gain is significant but has occurred on declining volume, which can be a warning sign. However, the RSI at 59.3 is not extreme, leaving room for further upside. Sustainability will depend on whether volume picks up and if ETH can break above the $1,956 resistance.
Q: What are the key levels to watch for a potential breakout?
A: For BTC, a break above $66,956 (7-day and 30-day high) would be bullish, while a drop below $63,100 (7-day low) could signal a bearish turn. For ETH, the key resistance is $1,956, and support is at $1,843 (7-day low) and $1,791 (30-day MA).
Q: How can Pionex bots help in this market environment?
A: Pionex’s grid trading bots are ideal for the current low-volatility, range-bound market. They automatically execute buy and sell orders within a set price range, profiting from small fluctuations. DCA bots are also suitable for gradual accumulation. Both bots run 24/7 and remove emotional decision-making.


