BTC ETH Daily Recap — 2026-07-31

BTC ETH Daily Recap — 2026-07-31
Today at a Glance
Bitcoin and Ethereum both closed the July 31 session in the red, with BTC sliding 2.79% to $62,972 and ETH dropping 3.04% to $1,860. The pullback was broad-based, though ETH’s weekly performance remains nearly flat (-0.08%) while BTC is down 1.82% over the same period. Both assets traded near their intraday lows at the time of writing, suggesting persistent selling pressure into the close. Volume was notably subdued — BTC traded at 0.89x its 7-day average, while ETH saw only 0.61x — indicating the move was driven more by thin liquidity than aggressive distribution. RSI readings have diverged: BTC sits at 45.6 (neutral-bearish) while ETH holds at 52.1 (neutral), reflecting ETH’s stronger relative momentum over the past month (+9.38% vs +2.29% for BTC). Neither asset has broken a major structural level, but the short-term tone is cautious.
Bitcoin Analysis
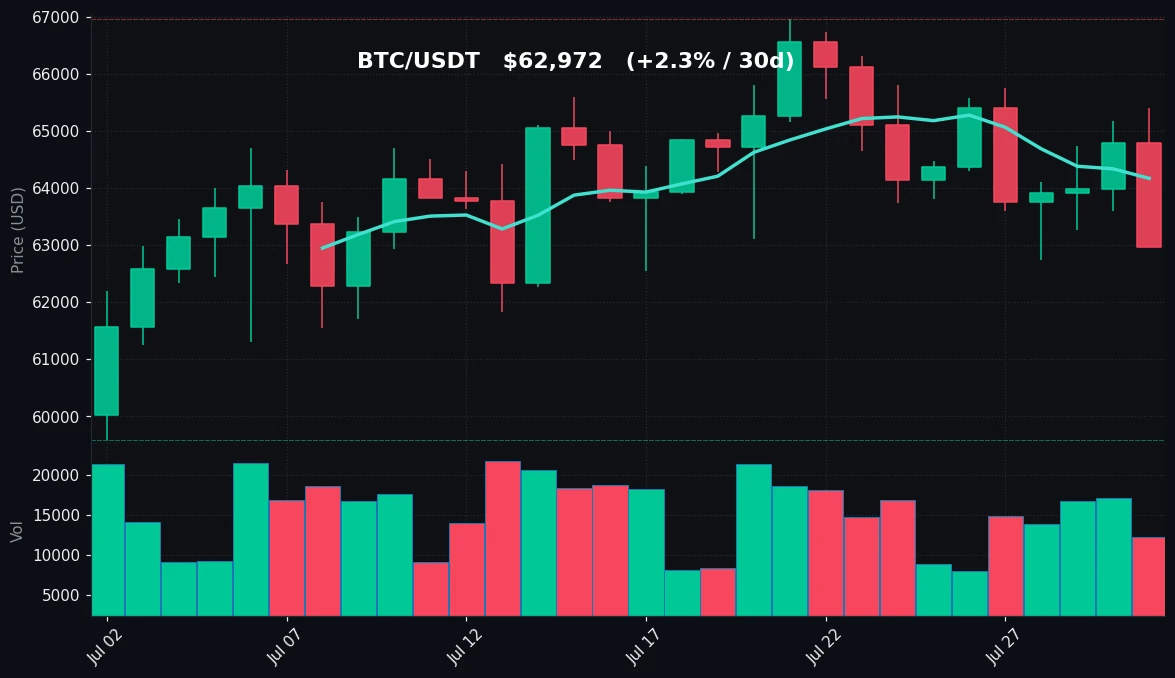
TradingView Live (4h)
Bitcoin’s price action on July 31 was decisively bearish, with the asset closing at its session low of $62,972 — a level that also marks the 24-hour low. The day’s range was $2,438, from a high of $65,410 to the current price. This close at the bottom of the range signals that buyers failed to defend higher levels, and momentum has shifted to the downside in the short term.
From a technical perspective, BTC is now trading below both its 7-day moving average ($64,169) and its 30-day moving average ($64,047). The fact that these two MAs are nearly converged suggests a period of consolidation is underway, but the current price below both is a bearish short-term signal. The 7-day low of $62,742 is just $230 below the current price, making it the immediate support to watch. A break below that would expose the psychological $60,000 zone, which aligns with the 30-day low of $59,588.
Volume analysis shows BTC traded at 0.89x its 7-day average volume. This is a critical nuance — the decline is not accompanied by high volume, which often indicates a lack of conviction behind the sell-off. Low-volume pullbacks within a broader range can sometimes be short-lived, but they also leave the market vulnerable to sharp moves if liquidity remains thin.
The RSI(14) at 45.6 sits in neutral territory, below the 50 midpoint but above the 30 oversold threshold. This suggests that while bearish momentum is present, the asset is not yet in an oversold condition. Historically, RSI in this zone can precede further downside if the price breaks key support, or a bounce if buyers step in at the range low.
The broader 30-day picture shows BTC is up 2.29%, with a range of $59,588 to $66,956. The current price is near the middle of that range, indicating that the asset has neither broken out nor broken down on a monthly basis. The 7-day high of $65,745 was rejected twice this week, establishing a clear resistance zone between $65,400 and $65,700.
In summary, Bitcoin is in a short-term downtrend within a larger consolidation range. The key levels to monitor are $62,742 (7-day low) as immediate support and $65,410–$65,745 as resistance. The low volume on the decline and neutral RSI leave the door open for either a continuation or a reversal, with no clear directional bias from the indicators.
Ethereum Analysis
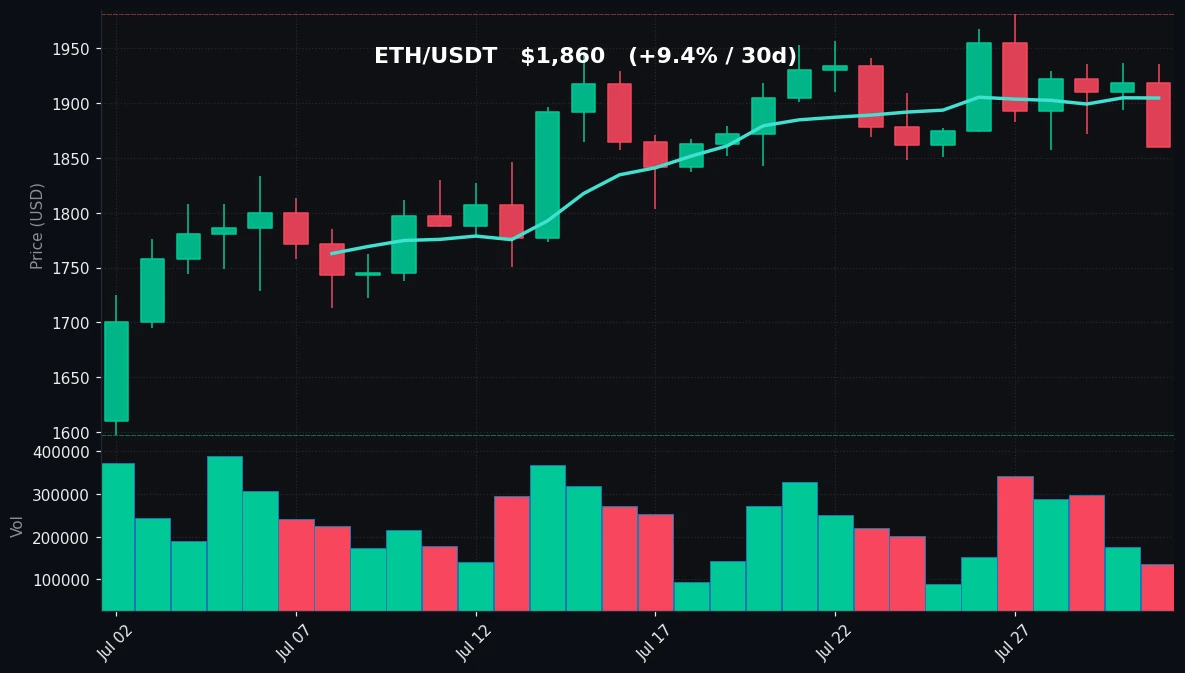
TradingView Live (4h)
Ethereum mirrored Bitcoin’s decline but with a slightly larger percentage drop, closing at $1,860 — its 24-hour low. The session range was $76, from a high of $1,936 to the current price. ETH’s 24-hour performance of -3.04% outpaced BTC’s -2.79%, continuing a pattern where ETH shows higher beta in both directions.
On the technical front, ETH is trading below its 7-day moving average of $1,905 but remains above its 30-day moving average of $1,845. This is a notable divergence from BTC, which is below both. The 30-day MA at $1,845 is now acting as a critical support level, and the asset is only $15 above it. The 7-day low of $1,851 is nearly identical to the 30-day MA, creating a confluence support zone between $1,845 and $1,851.
ETH’s monthly performance is significantly stronger than BTC’s — up 9.38% versus BTC’s +2.29%. The 30-day range for ETH is $1,597 to $1,981, and the current price sits in the upper third of that range. This suggests that while the short-term momentum has cooled, the medium-term trend remains constructive. The 30-day high of $1,981 was also the 7-day high, indicating that the $1,980 level has been a consistent ceiling over the past week.
Volume for ETH was notably light at 0.61x the 7-day average. This is even lower than BTC’s relative volume, reinforcing the notion that the sell-off is happening on thin liquidity. Low volume declines in an uptrend can often be viewed as a healthy pullback, but they also mean that any sharp move could be exaggerated.
The RSI(14) for ETH is 52.1, which is above the neutral 50 level and significantly higher than BTC’s 45.6. This indicates that ETH retains more bullish momentum on a relative basis. The RSI is also well above the oversold threshold, suggesting there is room for further downside before the asset becomes technically oversold.
ETH’s key support levels are $1,851 (7-day low) and $1,845 (30-day MA). A break below this confluence zone would open the path toward $1,800, a level that has not been tested since mid-July. On the upside, resistance sits at $1,936 (24-hour high) and $1,981 (7-day/30-day high).
In summary, Ethereum is showing more relative strength than Bitcoin, with a higher RSI, a positive monthly return, and price above its 30-day MA. However, the short-term trend is bearish, and the asset is approaching a critical support zone that will likely determine its next directional move.
Key Technical Levels
| Asset | Support | Resistance | RSI |
|---|---|---|---|
| BTC | $62,742 | $65,410 | Neutral (45.6) |
| ETH | $1,845 | $1,936 | Neutral (52.1) |
Notes: BTC’s immediate support is the 7-day low at $62,742, with a secondary support at $62,000 (psychological). The primary resistance is the 24-hour high of $65,410, followed by the 7-day high of $65,745. ETH’s support is the confluence of the 30-day MA at $1,845 and the 7-day low at $1,851. Resistance is at $1,936 (24-hour high) and $1,981 (7-day/30-day high). Both assets are in neutral RSI territory, with ETH slightly more bullish than BTC.
BTC vs ETH Dynamic
The correlation between Bitcoin and Ethereum remains strong, with both assets moving in tandem on July 31 — BTC down 2.79% and ETH down 3.04%. However, the magnitude of the moves reveals a subtle divergence in relative strength. ETH’s RSI at 52.1 versus BTC’s 45.6 indicates that Ethereum has maintained more of its upward momentum despite the pullback. This is also reflected in the weekly performance: ETH is nearly flat at -0.08% while BTC is down 1.82%. Over the past 30 days, ETH has outperformed BTC by a significant margin (+9.38% vs +2.29%). This suggests that while the two assets are highly correlated in the short term, capital rotation may be favoring Ethereum in the medium term. The lower volume on ETH relative to its 7-day average (0.61x) compared to BTC (0.89x) also suggests that the sell-off in ETH is less conviction-driven. In periods of market stress, ETH tends to exhibit higher beta, but the current data shows ETH holding up better on a relative basis, which could indicate a shift in market leadership within the crypto complex.
Strategy Fit
The current market conditions — characterized by low volume, neutral RSI on both assets, and price action near key support levels — suggest a range-bound environment rather than a strong trend. For traders, this type of market is well-suited to grid trading strategies, which profit from price oscillations within a defined range. BTC is trading between $62,742 and $65,745, while ETH is between $1,845 and $1,936. These ranges are wide enough to generate meaningful grid profits but narrow enough to avoid excessive risk from a breakout.
Pionex’s built-in grid trading bots are particularly well-suited for this environment. The platform offers both spot grid and futures grid bots that automatically place buy and sell orders within a user-defined price range. Given the current low volatility and neutral RSI, a grid strategy can capture the oscillations without requiring a directional bias. For more conservative traders, a DCA (Dollar-Cost Averaging) strategy remains viable, especially for ETH, which is trading above its 30-day MA and showing stronger medium-term momentum. DCA bots on Pionex can be set to accumulate at regular intervals, smoothing out the short-term noise.
Trend-following strategies are less attractive in this environment, as neither asset has established a clear directional trend. The convergence of BTC’s 7-day and 30-day MAs suggests consolidation, and the low volume on the decline does not confirm a strong downtrend. Traders should avoid adding leverage until a clear breakout or breakdown occurs. The most prudent approach is to deploy grid bots within the established ranges and use DCA for longer-term accumulation, particularly for ETH given its superior monthly performance.
Risk Disclaimer
This market recap is provided for informational and educational purposes only and does not constitute financial advice, investment advice, trading advice, or any other form of professional advice. Cryptocurrency markets are highly volatile and involve substantial risk of loss. Past performance is not indicative of future results. The data and analysis presented herein are based on publicly available information believed to be reliable, but accuracy and completeness are not guaranteed. You should consult with a qualified financial advisor before making any investment decisions. Trading cryptocurrencies involves risk, and you should never invest money you cannot afford to lose. The author and publisher of this recap hold no responsibility for any financial losses incurred as a result of acting on the information provided. Always conduct your own research and due diligence before entering any position.
FAQ
What caused the price decline on July 31, 2026?
The decline was characterized by low volume, with BTC trading at 0.89x and ETH at 0.61x of their 7-day average volumes. This suggests the move was driven by thin liquidity rather than aggressive selling. Neither asset broke major structural levels, and the pullback appears to be a consolidation within established ranges.
Is Bitcoin in a downtrend?
Based on the current data, Bitcoin is below its 7-day and 30-day moving averages, which is a short-term bearish signal. However, the RSI at 45.6 is neutral, and the low volume on the decline does not confirm a strong downtrend. The broader 30-day picture shows BTC is still up 2.29%, indicating a consolidation phase rather than a confirmed trend reversal.
Why is Ethereum outperforming Bitcoin?
ETH is up 9.38% over the past 30 days versus BTC’s +2.29%. ETH’s RSI of 52.1 is also higher than BTC’s 45.6. This relative strength could indicate capital rotation toward Ethereum, but it is not yet a definitive trend shift. The two assets remain highly correlated in the short term.
What are the key levels to watch?
For BTC, immediate support is at $62,742 (7-day low) with resistance at $65,410–$65,745. For ETH, support is at $1,845–$1,851 (30-day MA and 7-day low) with resistance at $1,936–$1,981. A break of these levels would likely determine the next directional move for each asset.
How should I approach trading in this environment?
Given the neutral RSI, low volume, and range-bound price action, grid trading strategies are well-suited for the current market. Pionex offers automated grid bots that can profit from range oscillations. For longer-term accumulation, DCA strategies remain viable, particularly for ETH which is showing stronger medium-term momentum. Avoid trend-following strategies until a clear breakout or breakdown occurs.


