BTC ETH Daily Recap — 2026-08-13

BTC ETH Daily Recap — 2026-08-13
Today at a Glance
August 13, 2026, delivered a session of muted consolidation across the crypto complex, with both Bitcoin and Ethereum posting marginal gains after a week of gentle downside drift. BTC/USDT settled at $63,738, up 0.41% on the day, while ETH/USDT closed at $1,891, gaining 0.62%. The intraday ranges were narrow — Bitcoin oscillated between $63,350 and $64,010, while Ethereum traded within a $27 band ($1,873–$1,900). Both assets remain below their respective 7-day moving averages, a signal that short-term momentum has yet to reclaim a bullish posture. Trading volume contracted notably, with BTC printing 0.52x its 7-day average and ETH at 0.59x, suggesting a lack of directional conviction. RSI readings — 42.1 for BTC and 45.1 for ETH — remain in neutral territory, tilted slightly toward oversold conditions without triggering extreme levels. The broader 30-day picture shows both assets down roughly 1.4–1.6%, with price action compressing inside well-defined ranges. This is a tape that rewards patience over impulse.
Bitcoin Analysis
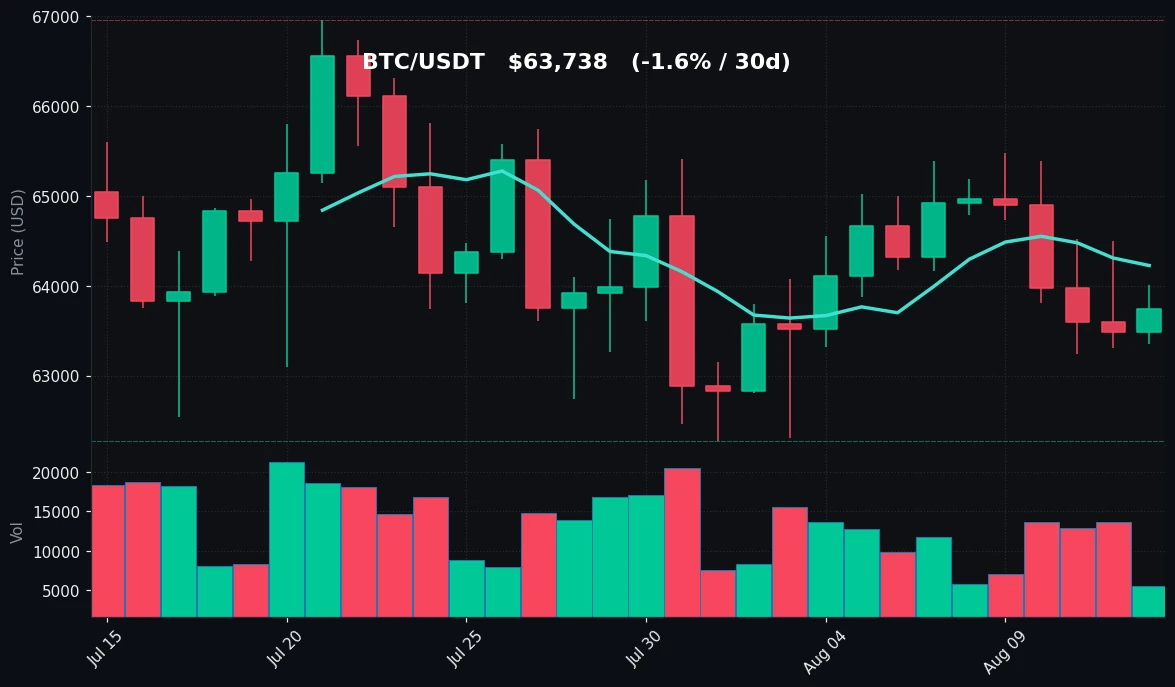
TradingView Live (4h)
Bitcoin's price action on August 13 reflects a market still digesting the late-July pullback from $66,956. The session opened near $63,500 and spent most of the day grinding higher, touching a local high of $64,010 before fading into the close at $63,738. The 24-hour change of +0.41% masks a more telling structural detail: BTC has now spent five consecutive sessions below its 7-day moving average of $64,225, while the 30-day MA sits marginally higher at $64,364. This confluence of short-term averages just above spot price creates a technical ceiling that buyers have been unable to clear since the August 6 dip to $63,238.
Volume analysis adds a layer of caution. The 0.52x volume ratio versus the 7-day average indicates participation is roughly half of what was seen during the recent volatility spike. Low-volume advances are inherently fragile; the +0.41% move occurred on thinner liquidity, which means the price discovery process is less robust than during high-activity sessions. The 7-day range of $63,238 to $65,474 shows a market that has been unable to hold gains above $65,000, with each rally attempt meeting seller resistance.
The RSI(14) at 42.1 places Bitcoin in the lower half of neutral territory, not yet oversold but clearly reflecting weakened bullish momentum. Comparing to the 30-day high of $66,956, the current price sits 4.8% off that peak, while the 30-day low of $62,275 is only 2.3% below spot. This asymmetry suggests the path of least resistance has been downward over the past month, though the absence of a breakdown below $62,275 indicates buyers are defending key support.
The MA7/MA30 relationship is notable: the two averages are converging, with MA7 ($64,225) now just $139 below MA30 ($64,364). This narrowing spread often precedes a volatility expansion. The current configuration — price below both averages, RSI sub-45, and volume contracting — describes a market in pause mode. The August 6 low of $63,238 and the broader $62,275–$63,350 zone represent the immediate demand area that has held for the past week. The $64,225–$64,364 band above remains the first supply zone.
Ethereum Analysis
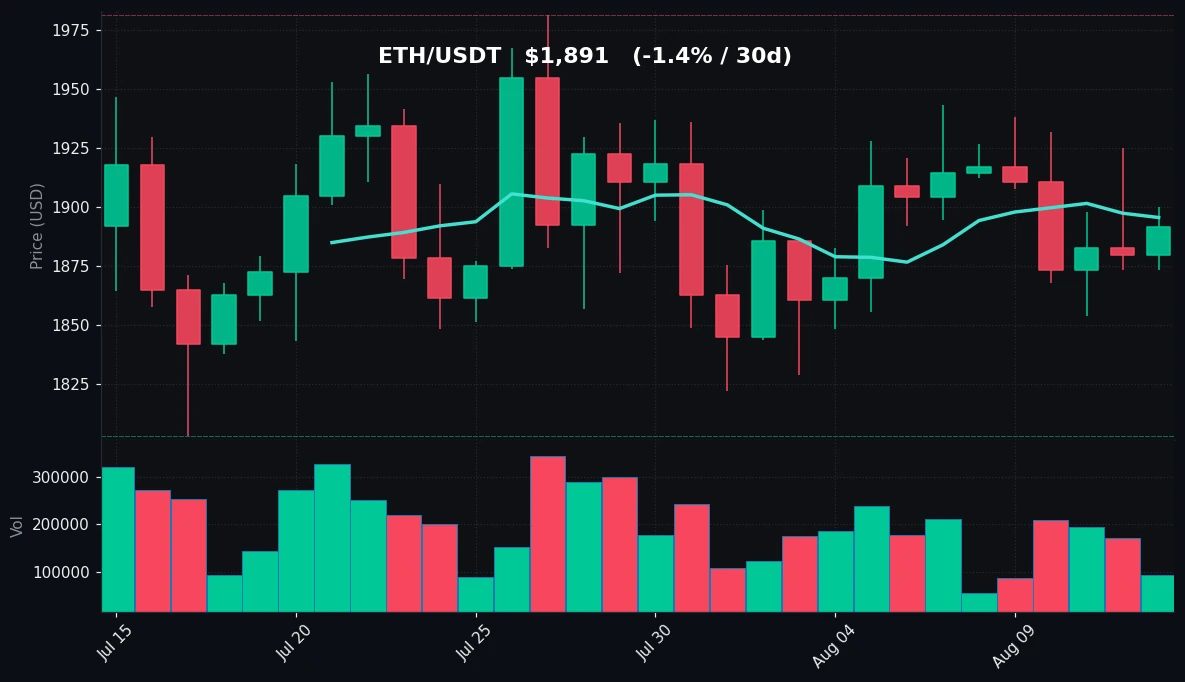
TradingView Live (4h)
Ethereum's August 13 session mirrored Bitcoin's structure but with a slightly firmer tone. ETH/USDT closed at $1,891, up 0.62%, with an intraday range of $1,873 to $1,900. The asset has been trading in an exceptionally tight band relative to its recent history — the 30-day range spans $1,803 to $1,981, a volatility envelope of roughly 9.9% from low to high. For context, that is a notably compressed range compared to earlier in the year, indicating a market that has settled into a high-volume consolidation phase.
The moving average structure for ETH differs subtly from BTC. MA7 sits at $1,896, while MA30 is $1,892 — a difference of just $4. Spot at $1,891 is essentially pinned to both averages, which is a hallmark of indecision. The 7-day high of $1,943 and low of $1,854 define a $89 range, and today's close is nearly dead center. This is not a trend market; it is a balanced, two-sided auction.
Volume for ETH contracted to 0.59x the 7-day average, similar to BTC's decline. The RSI(14) at 45.1 is slightly higher than Bitcoin's 42.1, confirming that ETH's relative strength is marginally better. However, the reading still sits below the 50 midpoint, meaning sellers retain a slight edge in momentum terms. The 30-day high of $1,981 was set in late July, and the subsequent pullback to $1,803 (a 9% drawdown) found buyers, with the asset bouncing back to the current $1,891 level.
The key technical observation for ETH is the compression of both time-based averages and the RSI into a tight cluster. When price, MA7, and MA30 all converge within a $5 band, it typically signals that a breakout is being prepared, though the direction remains unclear. The 30-day low of $1,803 serves as the primary support reference, while the 7-day high of $1,943 is the first meaningful resistance. The $1,900 psychological level also looms as a minor barrier, given that today's high touched but failed to hold above it.
ETH's relative performance versus BTC shows a slight edge: over 24 hours, ETH gained 0.62% versus BTC's 0.41%, and over 7 days ETH is down 0.67% versus BTC's 0.91%. This divergence is modest but consistent with a market where ETH is not leading the downside.
Key Technical Levels
| Asset | Support | Resistance | RSI |
|---|---|---|---|
| BTC | $63,238–$63,350 | $64,225–$64,364 | 42.1 (neutral, leaning oversold) |
| ETH | $1,803–$1,854 | $1,896–$1,943 | 45.1 (neutral) |
For BTC, the immediate support cluster is defined by the August 6 low of $63,238 and the 24-hour low of $63,350. A break below this zone opens the path toward the 30-day low of $62,275. Resistance is stacked at the MA7/MA30 confluence ($64,225–$64,364), followed by the 7-day high of $65,474. For ETH, support is anchored at the 30-day low of $1,803, with interim support at the 7-day low of $1,854. Resistance sits at the MA7 of $1,896, then the 7-day high of $1,943, and finally the 30-day high of $1,981. Both assets show RSI in neutral territory, but BTC's lower reading indicates it is closer to oversold conditions.
BTC vs ETH Dynamic
The 30-day correlation between BTC and ETH remains high, as is typical in crypto markets, but the magnitude of moves differs. Over the past week, BTC declined 0.91% while ETH fell only 0.67%, a divergence of 24 basis points. This suggests that ETH is exhibiting slightly better downside protection, possibly due to its deeper liquidity at current levels or a rotation of capital from BTC into ETH within the same risk budget. The 24-hour performance shows a similar pattern: ETH's +0.62% outpaced BTC's +0.41%. Neither asset is leading decisively; rather, they are moving in tandem with ETH showing marginally higher beta on the upside and lower beta on the downside. The ETH/BTC ratio has drifted slightly in ETH's favor over the past week, but the move is too small to call a regime shift. In a low-volume, rangebound environment, correlation tends to remain elevated, and the current data supports that expectation.
Strategy Fit
The current market structure — defined by narrow ranges, contracting volume, and RSI in neutral territory — is not conducive to trend-following approaches. The absence of directional momentum means breakout strategies are likely to generate false signals. Instead, the data suggests a rangebound or mean-reversion regime. For traders using grid strategies, the defined support and resistance levels identified above provide a natural framework. A BTC grid bot placed between $63,200 and $64,400 would capture the current oscillation, while an ETH grid between $1,850 and $1,940 aligns with the established 7-day range. The low volatility environment (BTC's 24h range was just 1.0%) favors higher-frequency grid intervals to accumulate small profits. For those preferring DCA, the current zone below both moving averages offers a reasonable accumulation point, though the lack of a confirmed bottom suggests scaling in rather than deploying full capital. The contraction in volume to roughly half the 7-day average is a warning that liquidity is thin; any news-driven spike could produce outsized moves. Pionex's built-in grid bots are well-suited to this environment, as they automate the buy-low/sell-high process within a defined range without requiring constant monitoring. Trend-following strategies should remain on standby until either a break above $64,364 (BTC) or below $63,238 with volume confirmation.
Risk Disclaimer
This market recap is provided for informational and educational purposes only. It does not constitute financial advice, investment advice, trading advice, or any other kind of advice. Cryptocurrency markets are highly volatile and involve substantial risk of loss. Past performance is not indicative of future results. The data presented herein is based on historical price information and technical indicators; it does not predict future price movements. You should consult with a qualified financial advisor before making any investment decisions. Never invest money you cannot afford to lose. The author and publisher assume no liability for any losses or damages arising from the use of this information. Always conduct your own research and due diligence.
FAQ
What is the significance of the RSI readings for BTC and ETH today?
The RSI(14) for BTC is 42.1 and for ETH is 45.1. Both are in neutral territory, meaning neither asset is overbought (typically above 70) nor oversold (typically below 30). However, BTC's reading is closer to oversold conditions, suggesting that bearish momentum is slightly more pronounced for BTC than for ETH.
Why is trading volume important in the current market context?
Volume at 0.52x (BTC) and 0.59x (ETH) of the 7-day average indicates reduced participation. Low volume during price movements means fewer market participants are driving the price, which can lead to less reliable price signals and increased susceptibility to sudden moves when liquidity returns.
What do the moving averages indicate for BTC?
BTC's MA7 is $64,225 and MA30 is $64,364. The price at $63,738 is below both averages. This is typically interpreted as a short-term bearish signal. The convergence of the two averages also suggests that the market is coiling, and a directional move may be approaching.
Are there any clear support levels for ETH?
The most prominent support is the 30-day low of $1,803. The 7-day low of $1,854 provides nearer-term support. Today's low of $1,873 also acts as a minor intraday reference. A break below $1,803 would represent a new 30-day low and likely trigger further downside.
How can grid trading bots be used in this market?
Given the defined ranges for both assets, grid trading bots can be programmed to buy at support levels and sell at resistance levels within the established bands. For example, a BTC grid between $63,238 and $64,364 would have captured today's price movement. Pionex offers automated grid bots that execute these trades without manual intervention, which is suitable for a rangebound market with low volatility.


