BTC ETH Daily Recap — 2026-10-04

BTC ETH Daily Recap — 2026-10-04
Today at a Glance
Bitcoin is trading at $85,245, up 0.58% over the past 24 hours, with an intraday range between $84,720 and $85,428. On a weekly basis, BTC has added 0.92%, while the 30-day change stands at +6.78%. The broader 7-day range spans $82,563 to $87,220, and the 30-day range runs from $74,968 to $87,396. Price remains above both the MA7 ($84,312) and MA30 ($81,285), with RSI(14) at 67.1. Volume versus the 7-day average is notably light at 0.23x.
Ethereum is at $2,697, up 0.36% in 24 hours, with a tight daily range of $2,687–$2,708. ETH is +0.31% over 7 days and +8.74% over 30 days. The 7-day range is $2,636–$2,777 and the 30-day range is $2,359–$2,807. ETH holds above its MA7 ($2,687) and MA30 ($2,595), with RSI(14) at 57.5 and volume at just 0.17x the 7-day average. Both assets are consolidating near the upper end of recent ranges on thin participation.
Bitcoin Analysis
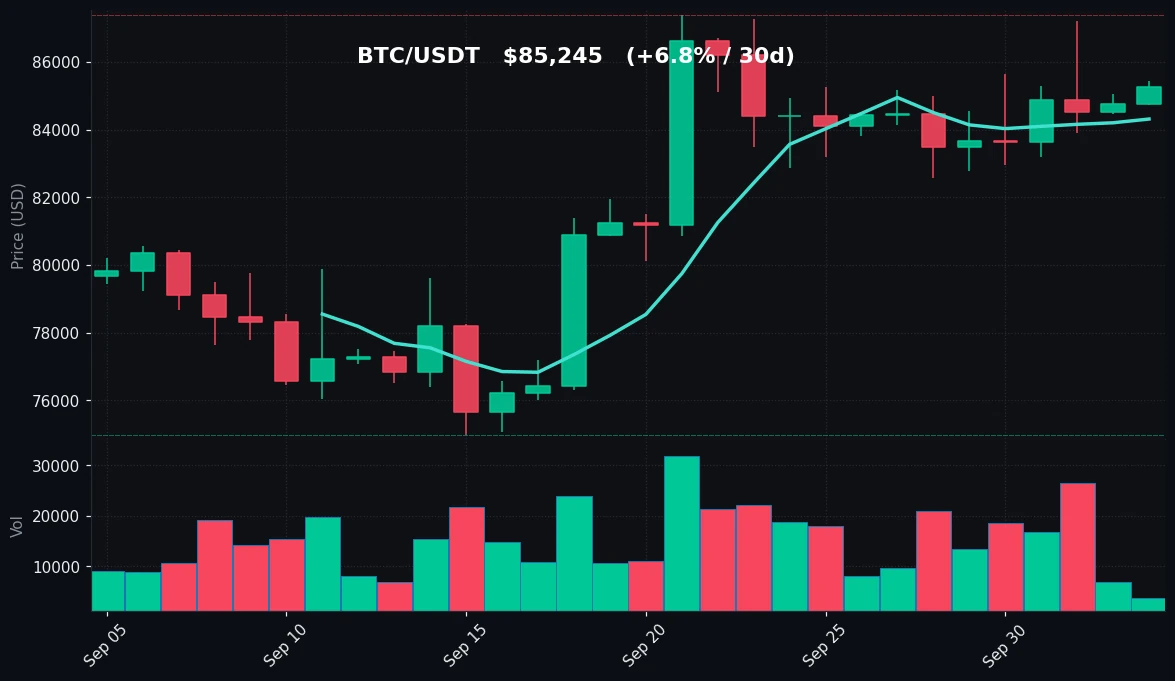
TradingView Live (4h)
Bitcoin's structure on the daily timeframe remains constructive but increasingly compressed. Price at $85,245 sits roughly 1.1% above the MA7 at $84,312 and about 4.9% above the MA30 at $81,285. The alignment of both moving averages beneath spot, with the shorter average above the longer one, reflects a market that has spent the past month recovering from the $74,968 low recorded within the 30-day window. That low now stands approximately 12% below current price, while the 30-day high of $87,396 is only about 2.5% above spot — a configuration that places BTC near the top of its monthly range rather than in the middle of it.
The immediate technical picture is defined by a relatively narrow band. The 7-day high at $87,220 and the 30-day high at $87,396 cluster closely together, forming a clear resistance shelf in the mid-$87,000s. On the downside, the MA7 at $84,312 is the first level of interest, followed by the 7-day low at $82,563, which sits just above the MA30 at $81,285. That $81,285–$82,563 zone represents a confluence of trend support and the recent weekly floor. The 24-hour range of $84,720–$85,428 was tight — a span of just over $700, or roughly 0.8% of price — indicating limited intraday directional conviction.
Momentum, as measured by RSI(14) at 67.1, is in neutral-to-elevated territory. It is below the traditional 70 overbought threshold but high enough to indicate that the recent grind higher has absorbed most of the easy momentum. Notably, RSI is not diverging sharply from price — both have drifted upward together over the past month — but the absence of a push above 70 during a period when price is near monthly highs suggests the advance has been steady rather than euphoric.
The most striking data point is volume. At 0.23x the 7-day average, participation is exceptionally thin. This has two implications worth noting from a structural standpoint. First, thin volume can exaggerate the significance of small price moves, since less capital is required to shift the tape. Second, low-volume consolidations near range highs often reflect a market in equilibrium — neither aggressive buyers nor aggressive sellers are dominant. The combination of price above both moving averages, RSI in the high-60s, and volume at a fraction of its recent average describes a market that is holding its gains but not currently attracting fresh momentum-driven flow.
Ethereum Analysis
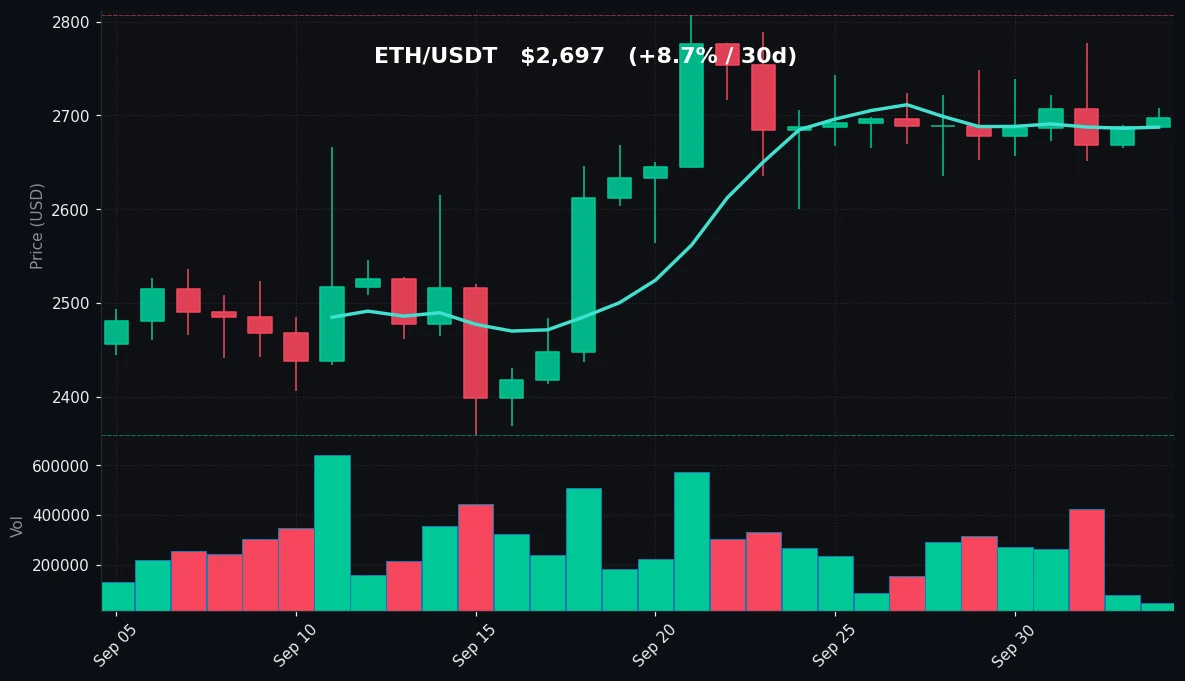
TradingView Live (4h)
Ethereum's positioning is similar in direction but softer in momentum. At $2,697, ETH trades marginally above its MA7 of $2,687 — a gap of about 0.4% — and roughly 3.9% above the MA30 at $2,595. The 30-day performance of +8.74% outpaces BTC's +6.78%, indicating that ETH has been the relative outperformer over the past month, even as its shorter-term movement has flattened. The 30-day low of $2,359 is now approximately 14% below spot, while the 30-day high of $2,807 is about 4.1% above, placing ETH somewhat further from its monthly peak than BTC is from its own.
The technical levels are clearly delineated. Resistance is anchored by the 30-day high at $2,807, with the 7-day high at $2,777 forming a nearer ceiling. The 24-hour high of $2,708 essentially marks the immediate intraday cap. On the support side, the MA7 at $2,687 is being tested in real time — spot at $2,697 is only about $10 above it — and the 7-day low at $2,636 provides the next meaningful floor. Below that, the MA30 at $2,595 is the deeper trend reference. The 24-hour range of $2,687–$2,708 is remarkably tight at roughly $21, or under 0.8% of price, mirroring BTC's compressed session.
RSI(14) at 57.5 places ETH firmly in neutral territory, notably cooler than BTC's 67.1. This gap suggests that while ETH has outperformed over the 30-day lookback, its recent sessions have been more sideways than BTC's. The price is holding above both moving averages, but the momentum reading does not indicate an overextended condition in either direction.
Volume is the standout observation: at 0.17x the 7-day average, ETH's participation is even lighter than BTC's already-thin 0.23x. This is a notably quiet reading. In structural terms, a market drifting higher on declining volume near the upper half of its range often reflects consolidation rather than accumulation or distribution. The $2,687 MA7 level is the pivot to watch — price has held it so far, but the thin tape means the level is being defended with relatively little volume behind it. The broader picture is one of a market that has recovered strongly from the $2,359 monthly low, paused beneath the $2,777–$2,807 resistance band, and is now waiting for either a volume expansion or a clear rejection to define the next structural move.
Key Technical Levels
| Asset | Support | Resistance | RSI |
|---|---|---|---|
| BTC | $84,312 (MA7) / $82,563 (7d low) / $81,285 (MA30) | $87,220 (7d high) / $87,396 (30d high) | 67.1 — neutral, approaching overbought |
| ETH | $2,687 (MA7) / $2,636 (7d low) / $2,595 (MA30) | $2,777 (7d high) / $2,807 (30d high) | 57.5 — neutral |
BTC vs ETH Dynamic
BTC and ETH are moving in the same direction but at different tempos, and the divergence in their momentum readings is the key dynamic today. Over the 30-day window, ETH (+8.74%) has outpaced BTC (+6.78%), yet on the shorter horizons the relationship flips: BTC is +0.58% on the day and +0.92% on the week, versus ETH's +0.36% and +0.31%. This suggests ETH led the monthly recovery but has since ceded short-term leadership to BTC, which is now pressing closer to its range highs. The RSI spread — 67.1 for BTC versus 57.5 for ETH — reinforces that BTC carries the stronger near-term momentum, while ETH's more muted reading reflects its sideways drift. Both assets share the same structural characteristic: price above rising moving averages, compressed daily ranges, and volume far below recent averages (0.23x for BTC, 0.17x for ETH). The correlation remains high in direction, but the magnitude gap means BTC is currently the momentum vehicle and ETH the laggard within a shared consolidation.
Strategy Fit
Today's data describes a low-volatility, low-volume consolidation with both assets pinned near the upper end of their monthly ranges. BTC's 24-hour range was ~0.8% of price and ETH's was under 0.8%, while volume ran at 0.23x and 0.17x of the 7-day average respectively. In this kind of environment — range-bound price action with compressed intraday movement — grid-style strategies are structurally suited, as they seek to capture repeated oscillations within a defined band rather than requiring a directional breakout. The relevant bands are visible in the data: for BTC, roughly $82,563 to $87,220; for ETH, roughly $2,636 to $2,777. Conversely, trend-following approaches typically need sustained directional movement and volume expansion, neither of which is present in today's readings. DCA-style accumulation is a third framework some participants use during quiet consolidation phases, though it is agnostic to the technical levels above. Pionex offers built-in bots — including grid trading and DCA bots — that are designed to operate within user-defined parameters, which can be relevant when markets are range-bound. Any strategy choice should account for the fact that thin volume can precede volatility expansion in either direction, and parameters should be set accordingly.
Risk Disclaimer
This article is for informational purposes only and does not constitute financial, investment, or trading advice. It is not a recommendation to buy, sell, or hold any asset. Cryptocurrency markets are highly volatile and can result in the total loss of capital. The technical levels, indicators, and strategy frameworks discussed are observations based on historical price data and do not predict future outcomes. Always conduct your own research and consult a qualified professional before making any financial decisions.
FAQ
What is BTC's price today?
Bitcoin is trading at $85,245, up 0.58% over 24 hours, with a daily range of $84,720 to $85,428.
What is ETH's price today?
Ethereum is trading at $2,697, up 0.36% over 24 hours, with a daily range of $2,687 to $2,708.
What do the RSI readings indicate?
BTC's RSI(14) is 67.1, which is neutral but approaching the traditional overbought threshold of 70. ETH's RSI(14) is 57.5, placing it comfortably in neutral territory.
Why is volume significant today?
BTC volume is at 0.23x its 7-day average and ETH volume is at 0.17x, both exceptionally low. Thin volume during consolidation can mean small moves carry outsized significance, and it may precede a volatility expansion.
What are the key levels to watch?
For BTC, support sits at $84,312 (MA7) and $82,563 (7-day low), with resistance at $87,220–$87,396. For ETH, support is at $2,687 (MA7) and $2,636 (7-day low), with resistance at $2,777–$2,807.


