BTC ETH Daily Recap — 2026-10-11

BTC ETH Daily Recap — 2026-10-11
Today at a Glance
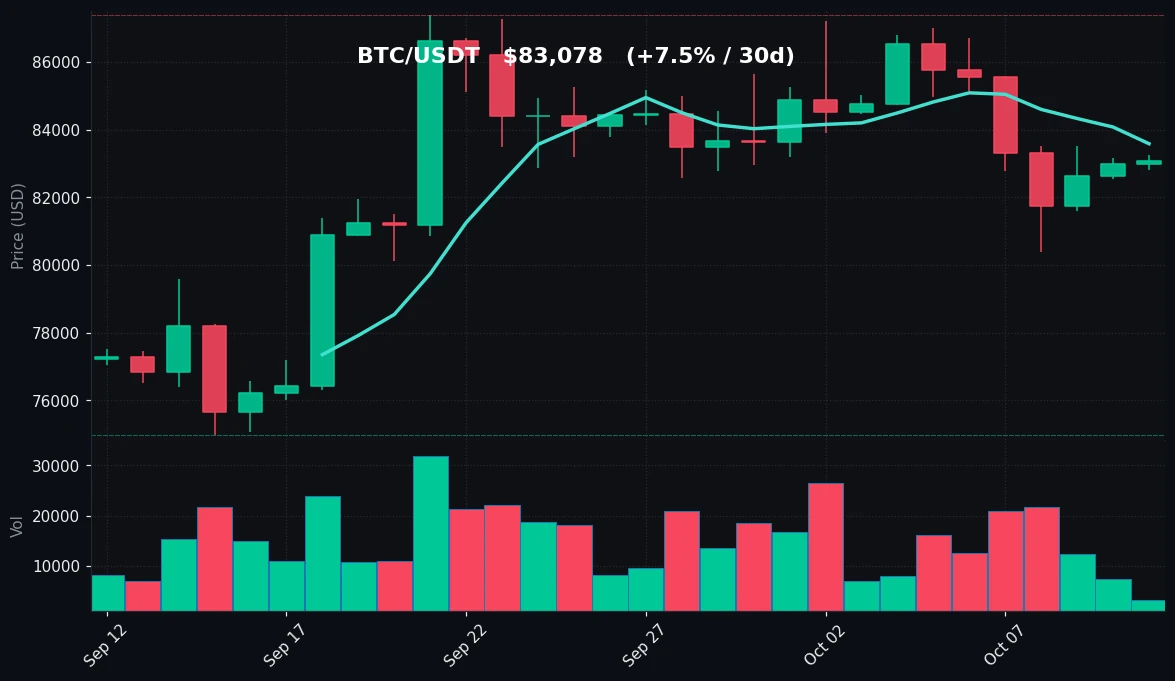
Bitcoin enters the October 11 session trading at $83,078, essentially flat over 24 hours (+0.11%) after a contained range between $82,805 and $83,259. The calm surface masks a softer week: BTC is down 3.99% over seven days, having retreated from a 7-day high of $86,999 toward a weekly low of $80,394. On the monthly frame, however, the picture remains constructive at +7.50%, with the 30-day range spanning $74,968 to $87,396.
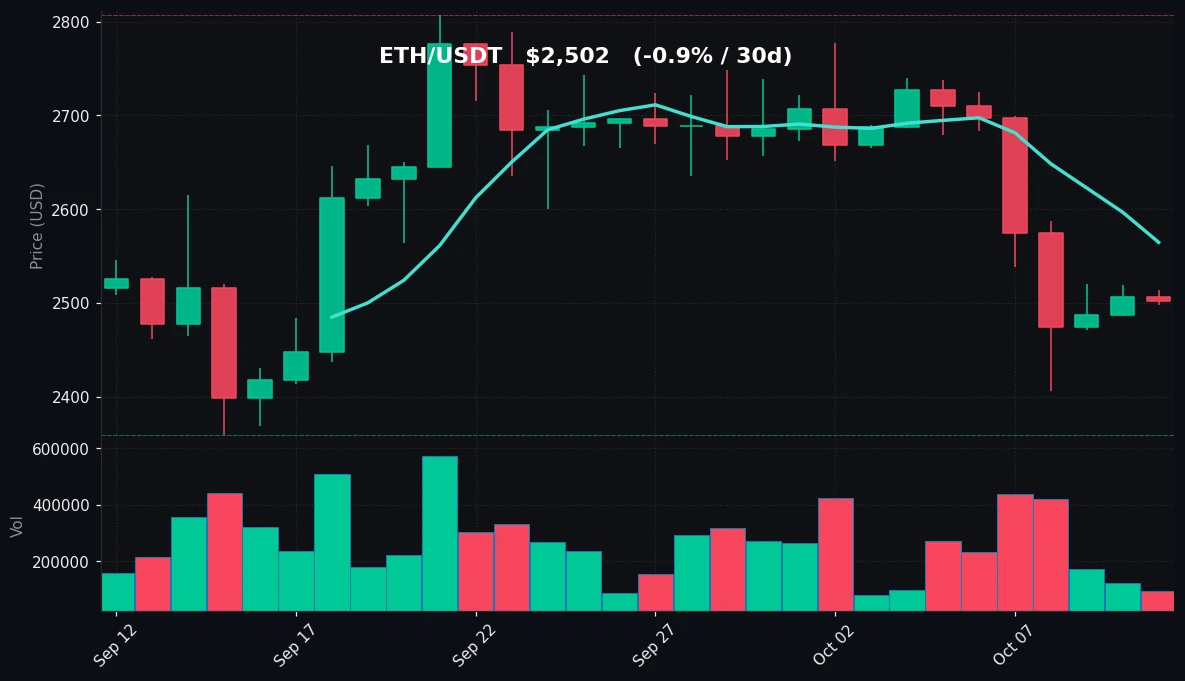
Ethereum is the weaker side of the pair today. ETH trades at $2,502, down 0.17% in 24 hours and 8.24% over seven days, with a 30-day change of -0.94%. The 7-day range of $2,406–$2,738 shows how much ground was given back, and ETH's RSI(14) of 28.0 places it in oversold territory. Volume on both assets is running well below recent averages — BTC at 0.22x and ETH at 0.37x of their 7-day averages — signaling a market in wait-and-see mode.
Bitcoin Analysis
TradingView Live (4h)
Bitcoin's daily structure is best described as a consolidation within a broader recovery. Price at $83,078 sits above the 30-day moving average of $82,503 but below the 7-day moving average of $83,585 — a configuration that reflects short-term cooling inside a still-positive monthly trend. The +7.50% 30-day performance, measured from a low of $74,968, confirms that the dominant move over the past month has been upward; the current week's -3.99% pullback is a retracement within that larger advance rather than a trend reversal on the higher timeframe.
Key technical levels are clearly defined by recent price action. On the downside, the weekly low at $80,394 is the first meaningful support zone, followed by the 30-day low at $74,968, which marks the floor of the monthly range. On the upside, immediate resistance sits at the 7-day high of $86,999, with the 30-day high of $87,396 just above it — a tight cluster that represents the level bulls need to reclaim to reassert momentum. Between these boundaries, the 30-day moving average at $82,503 acts as a dynamic pivot; holding above it keeps the monthly structure intact.
Momentum is neutral-to-soft. RSI(14) at 43.6 is below the midline but well above oversold territory, consistent with a market that has cooled without capitulating. The most notable data point is volume: BTC is trading at just 0.22x its 7-day average, meaning today's session is exceptionally thin. Low volume during a pullback can indicate seller exhaustion, but it equally reflects a lack of conviction from buyers. In practice, it means today's price action carries less informational weight than a high-volume session would.
The 24-hour range of $82,805–$83,259 is unusually narrow — roughly 0.55% of price — reinforcing the compression theme. Bitcoin is coiling between its moving averages, and the resolution of this low-volatility state will likely depend on whether volume returns. For now, the objective read is: monthly uptrend intact, weekly pullback in progress, daily momentum neutral, and participation muted.
Ethereum Analysis
TradingView Live (4h)
Ethereum's setup is materially weaker than Bitcoin's on nearly every metric. At $2,502, ETH trades below both its 7-day moving average of $2,565 and its 30-day moving average of $2,615 — a bearish alignment where shorter-term averages sit beneath longer-term ones, and price sits beneath both. The 30-day change of -0.94% is essentially flat, meaning the past month has delivered no net progress despite a wide range from $2,359 to $2,807.
The weekly decline of 8.24% is the headline concern. ETH fell from a 7-day high of $2,738 to a low of $2,406, a swing of roughly 12% peak-to-trough, and has recovered only modestly to the current $2,502. That recovery has stalled: the 24-hour range of $2,498–$2,514 is extraordinarily tight, less than 0.7% of price, suggesting the asset is pausing after its drop rather than actively rebounding.
Support and resistance are well marked. The immediate support zone is the weekly low at $2,406, which also sits near the 30-day low of $2,359 — a confluence band between roughly $2,360 and $2,410 that represents the critical floor. A sustained break below it would confirm the weekly downtrend's continuation. On the upside, the 7-day moving average at $2,565 is the first hurdle, followed by the 7-day high at $2,738 and the 30-day high at $2,807. ETH must reclaim the $2,565 area before any broader recovery case can be made.
RSI(14) at 28.0 is the standout reading — technically oversold. This indicates that recent selling has been persistent and that the asset is stretched to the downside on a momentum basis. Oversold conditions do not guarantee a bounce, particularly in low-volume environments, but they do signal that the easy part of the decline may be behind the market in the near term. Volume at 0.37x the 7-day average confirms that sellers are not pressing with size today.
The relative picture matters: ETH is underperforming BTC by a wide margin over the week (-8.24% vs -3.99%), and its position below both moving averages contrasts with BTC's hold above the 30-day MA. Until ETH reclaims $2,565, the path of least resistance remains sideways-to-lower within the established range.
Key Technical Levels
| Asset | Support | Resistance | RSI |
|---|---|---|---|
| BTC | $82,503 / $80,394 | $83,585 / $86,999 | 43.6 — neutral |
| ETH | $2,406 / $2,359 | $2,565 / $2,738 | 28.0 — oversold |
BTC vs ETH Dynamic
The BTC/ETH relationship today is one of shared direction but divergent strength. Both assets are marginally negative to flat over 24 hours and both are in weekly drawdowns, which confirms the high positive correlation typical of large-cap crypto — macro flows, not idiosyncratic news, are driving the tape. But the magnitude gap is significant: ETH's 8.24% weekly decline is more than double BTC's 3.99%, and ETH's RSI of 28.0 versus BTC's 43.6 shows the selling pressure has been concentrated in the higher-beta asset. Structurally, BTC holds above its 30-day moving average while ETH trades below both its 7- and 30-day averages, meaning capital is currently favoring Bitcoin as the relative safe haven within the pair. Volume ratios reinforce the theme — ETH at 0.37x its average is more active than BTC at 0.22x, suggesting the outflows are ETH-specific rather than broad-market. For traders, the practical implication is that BTC is consolidating while ETH is testing whether its oversold condition attracts dip-buyers.
Strategy Fit
Today's conditions — compressed intraday ranges, below-average volume, and a market oscillating around moving averages — are classically hostile to trend-following approaches and more accommodating to range-based and accumulation strategies.
For BTC, the tight $82,805–$83,259 session range and neutral RSI of 43.6 fit a grid strategy, which profits from repeated oscillation between defined boundaries. A grid set between the weekly low of $80,394 and the 7-day high of $86,999 would capture the broader consolidation, while a tighter grid around the $82,503–$83,585 moving-average band targets the current compression.
For ETH, the oversold RSI of 28.0 and proximity to the $2,406–$2,359 support confluence make a DCA approach reasonable for those with a longer horizon, since staggered entries below the 7-day MA of $2,565 average into weakness rather than chasing. Trend strategies are less suitable today for either asset: BTC lacks directional conviction on low volume, and ETH's trend is still pointed down until $2,565 is reclaimed.
Pionex offers built-in bots that map directly to these conditions — grid trading bots for the range-bound BTC setup, DCA bots for staggered ETH accumulation, and rebalancing bots for traders who want to maintain a target BTC/ETH weighting as the relative strength gap evolves. Matching the tool to the regime — range, not trend — is the key discipline in a session like this.
Risk Disclaimer
This article is for informational purposes only and does not constitute financial, investment, or trading advice. The data and analysis presented reflect market conditions as of 2026-10-11 and may change rapidly. Cryptocurrency markets are highly volatile and can result in the loss of your entire capital. Technical indicators such as RSI and moving averages are historical tools, not predictive guarantees. Past performance is not indicative of future results. Always conduct your own research and consult a licensed financial advisor before making any investment decisions. You are solely responsible for your own trading outcomes.
FAQ
What is Bitcoin's price today?
BTC/USDT is trading at $83,078, up 0.11% over 24 hours, within a daily range of $82,805 to $83,259.
Why is Ethereum underperforming Bitcoin this week?
ETH is down 8.24% over seven days versus BTC's 3.99% decline. ETH trades below both its 7-day ($2,565) and 30-day ($2,615) moving averages, while BTC holds above its 30-day average of $82,503, indicating capital rotation toward Bitcoin.
What does an RSI of 28.0 mean for Ethereum?
An RSI(14) of 28.0 places ETH in oversold territory, meaning recent selling has been persistent and momentum is stretched to the downside. It does not guarantee a reversal, especially with volume at only 0.37x the 7-day average.
What are the key levels to watch?
For BTC: support at $82,503 and $80,394; resistance at $83,585 and $86,999. For ETH: support at $2,406 and $2,359; resistance at $2,565 and $2,738.
Which trading strategy suits today's market?
With compressed ranges and low volume, grid strategies fit BTC's consolidation and DCA suits ETH's oversold condition. Trend-following is less appropriate given the lack of directional conviction. Pionex's built-in grid, DCA, and rebalancing bots are designed for these regime types.


