BTC ETH Daily Recap — 2026-10-14

BTC ETH Daily Recap — 2026-10-14
Today at a Glance
Bitcoin changed hands at $82,300, down 1.04% over 24 hours, with the session range compressed between a high of $84,147 and a low of $82,300 — meaning BTC closed the day at its intraday floor. The 7-day print stands at -1.23%, while the 30-day remains positive at +8.80%, a reminder that the broader October trend is still constructive even as short-term momentum cools. Volume ran at 0.78x the 7-day average, indicating participation thinned during the pullback.
Ethereum was the weaker of the two, trading at $2,451 for a 24-hour decline of 1.86% and a 7-day drop of 4.77%. ETH also closed at its session low and sits 5.8% below its 7-day high of $2,587. Its 30-day performance is barely positive at +2.22%. Notably, ETH volume was just 0.54x the 7-day average — roughly half of normal activity — while RSI(14) at 31.0 places it near oversold territory, versus BTC's more neutral 45.4.
Bitcoin Analysis
TradingView Live (4h)
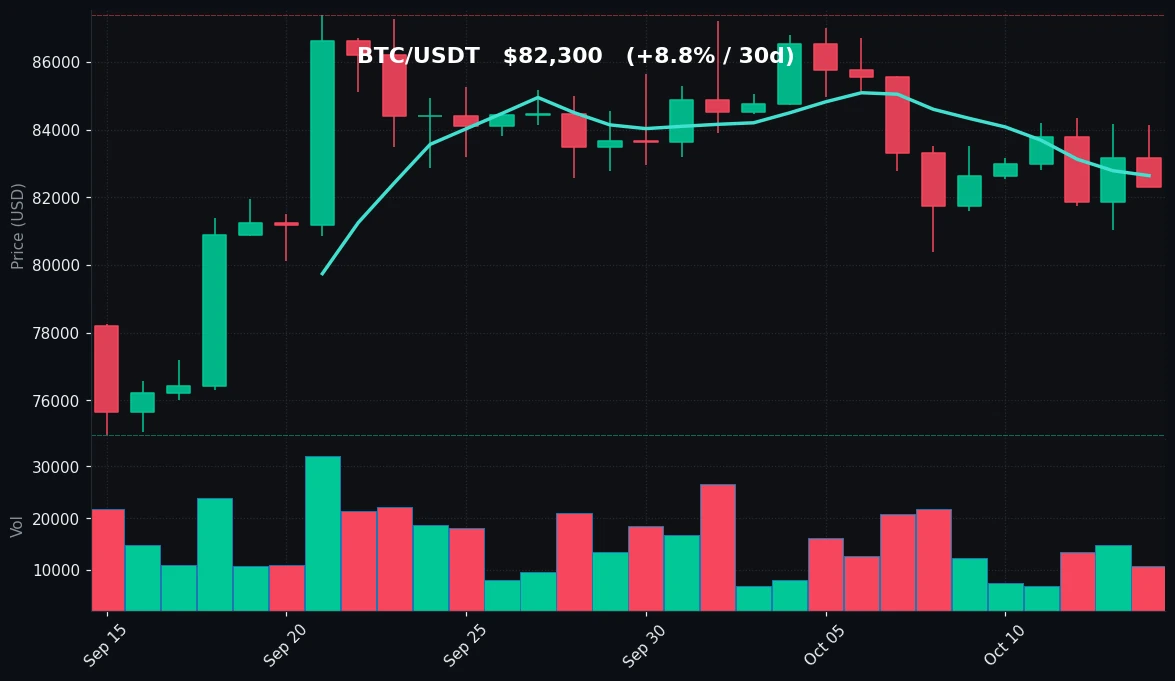
Bitcoin's structure on the daily timeframe shows a market in a controlled retracement rather than a breakdown. Price at $82,300 sits marginally below both the MA7 at $82,639 and the MA30 at $83,027, a configuration that signals short-term momentum has flipped negative while the medium-term average has not yet been decisively lost. The two moving averages are within roughly $400 of each other — a tight cluster that typically precedes a volatility expansion once price resolves in either direction. For now, the fact that BTC is trading essentially at the midpoint of that cluster suggests indecision rather than conviction selling.
The 7-day range between $80,394 and $84,352 frames the immediate battlefield. The $80,394 low is the more important reference: it held once already this week, and a sustained move below it would put the 30-day low of $74,968 back into view as the next structural support. To the upside, the 7-day high at $84,352 and the 30-day high at $87,396 form the two resistance shelves that bulls would need to reclaim to reassert the +8.80% 30-day trend. Today's high of $84,147 failed just short of the 7-day ceiling, which is a useful tell — sellers are still active into the $84K area.
Volume is the notable soft spot. At 0.78x the 7-day average, this decline is occurring on below-average participation. In technical terms, low-volume pullbacks are generally less conclusive than high-volume ones; they can reflect simple absence of buyers rather than aggressive distribution. That said, thin tape also means the market is more susceptible to sharp moves on modest order flow, so the low-volume condition cuts both ways.
RSI(14) at 45.4 is squarely neutral. It is neither oversold nor overbought, and it has room to travel in either direction before hitting an extreme. Combined with price pinned to the MA cluster and volume below trend, the honest read is a market consolidating after its 30-day advance, with the $80,394–$84,352 band defining the near-term parameters. The 30-day gain of 8.80% remains intact as long as the $80K shelf holds.
Ethereum Analysis
TradingView Live (4h)
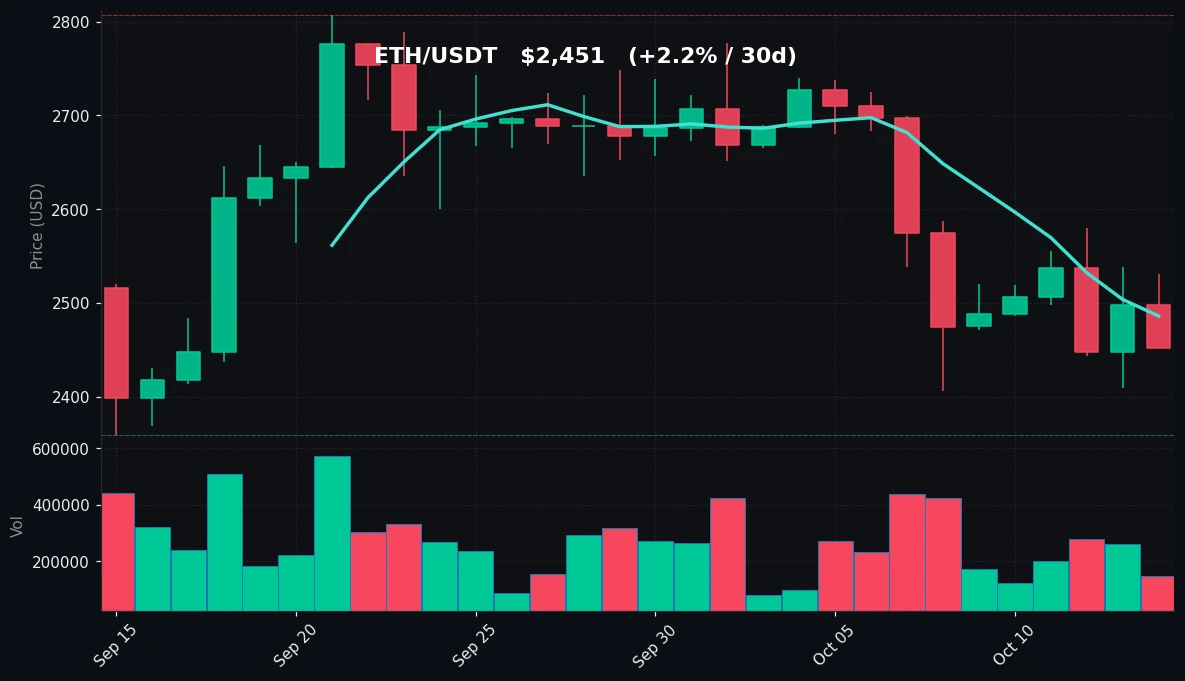
Ethereum's chart is materially weaker than Bitcoin's on almost every metric. At $2,451, ETH is trading below both its MA7 ($2,486) and its MA30 ($2,612), and the gap between the two averages — roughly $126 — is wide and widening in the bearish direction, with the shorter average beneath the longer one. That is the classic signature of a downtrend on the daily, not a mere consolidation. The 7-day decline of 4.77% is nearly four times BTC's 7-day drawdown, and ETH closed today at its intraday low of $2,451, a sign that sellers retained control through the close.
The levels are clear. Immediate support is the 7-day low at $2,406, which is only about 1.8% below the current price and therefore very much in play. Below that, the 30-day low at $2,359 is the deeper structural floor. Resistance comes first at the MA7 near $2,486, then the 7-day high at $2,587, and then the 30-day high at $2,807 — a level that now looks distant given the current trajectory. ETH has surrendered roughly 12.7% from that 30-day peak, a drawdown that meaningfully exceeds BTC's 5.8% pullback from its own 30-day high.
The RSI(14) reading of 31.0 is the most striking data point. It is on the cusp of oversold and is the lowest oscillator reading across the two assets. In isolation, an RSI near 30 can signal that selling is becoming stretched, but it is not a reversal signal on its own — momentum can persist at low RSI readings during sustained declines. What complicates the oversold argument here is volume: at 0.54x the 7-day average, ETH is seeing roughly half its normal activity. A near-oversold RSI on collapsing volume often describes exhaustion of sellers rather than capitulation, but it equally describes a market with no buyers stepping in. The distinction cannot be resolved from today's data alone.
The relative picture is unambiguous: ETH is underperforming BTC on the 24-hour (-1.86% vs -1.04%), 7-day (-4.77% vs -1.23%), and 30-day (+2.22% vs +8.80%) horizons. The $2,406 support is the line that matters most in the immediate term; a hold there with RSI stabilizing would be the first constructive development, while a break opens the $2,359 zone.
Key Technical Levels
| Asset | Support | Resistance | RSI |
|---|---|---|---|
| BTC | $80,394 (7d low) / $74,968 (30d low) | $84,352 (7d high) / $87,396 (30d high) | 45.4 — neutral |
| ETH | $2,406 (7d low) / $2,359 (30d low) | $2,486 (MA7) / $2,587 (7d high) | 31.0 — near oversold |
BTC vs ETH Dynamic
The two majors are moving in the same direction but at very different amplitudes, and that divergence is the defining feature of today's tape. BTC's 24-hour decline of 1.04% against ETH's 1.86% means ETH is falling at roughly 1.8x BTC's rate; over seven days the ratio widens dramatically, with ETH's -4.77% against BTC's -1.23%. Both closed at session lows, which confirms the correlation in direction — this is a broad risk-off drift, not an idiosyncratic ETH event. But the beta is one-sided: capital appears to be rotating toward BTC on a relative basis, a pattern consistent with the 30-day spread of +8.80% versus +2.22%. ETH's RSI at 31.0 versus BTC's 45.4 quantifies the same story from the momentum side. The practical implication is that ETH currently offers higher downside sensitivity to any further BTC weakness, while its near-oversold condition means any BTC stabilization could produce a sharper ETH bounce. Correlation in direction, divergence in magnitude — that is the regime.
Strategy Fit
Today's conditions — below-average volume on both assets, BTC pinned to a tight moving-average cluster, ETH near oversold with compressed participation — describe a range-bound, low-conviction market rather than a clean directional trend. In such an environment, mean-reversion and accumulation approaches tend to fit the observed data better than momentum-chasing entries.
For BTC, the $80,394–$84,352 band provides a defined range that suits grid-style strategies, which place staggered buy and sell orders within a set price corridor and profit from oscillation rather than direction. Pionex's built-in Grid Trading Bot is designed for exactly this condition, automating order placement across a chosen range so that sideways chop is worked rather than waited out. For ETH, the near-oversold RSI combined with the visible $2,406 support makes a dollar-cost-averaging approach — Pionex offers a DCA Bot for scheduled, fixed-interval accumulation — a structurally coherent fit for traders with a longer horizon, since it removes the need to time a bottom that today's data cannot confirm. Trend-following strategies are the least aligned with current conditions: neither asset is in a confirmed directional move, and volume is too thin to validate a breakout. Whichever approach is used, position sizing should reflect that both assets are trading below their short-term moving averages, and that the low-volume backdrop can amplify slippage on either side.
Risk Disclaimer
This article is for informational and educational purposes only and does not constitute financial, investment, or trading advice. It is not a recommendation to buy, sell, or hold any asset. Cryptocurrency markets are highly volatile and can result in the total loss of capital. Technical indicators such as RSI and moving averages describe past price behavior and do not predict future outcomes. All data referenced is as of 2026-10-14 and may change rapidly. Readers should conduct their own research and consult a qualified financial professional before making any investment decision. Any mention of trading bots or platforms is descriptive, not an endorsement.
FAQ
What was Bitcoin's price on 2026-10-14?
BTC/USDT traded at $82,300, down 1.04% over 24 hours, with an intraday high of $84,147 and a low of $82,300.
How did Ethereum perform compared to Bitcoin?
ETH underperformed across all measured horizons: -1.86% versus -1.04% on 24 hours, -4.77% versus -1.23% on 7 days, and +2.22% versus +8.80% on 30 days.
What do the RSI readings indicate?
BTC's RSI(14) of 45.4 is neutral, while ETH's 31.0 is near the oversold threshold. Neither reading is a standalone buy or sell signal.
Why does low volume matter in this recap?
BTC traded at 0.78x and ETH at 0.54x their respective 7-day average volumes. Below-average volume makes price moves less conclusive and can increase the impact of individual orders.
Which trading strategy fits today's conditions?
Range-bound conditions with low volume and a near-oversold ETH RSI align more closely with grid and DCA approaches than with trend-following. Pionex's built-in Grid Trading and DCA Bots are examples of tools built for these scenarios.


