BTC ETH Daily Recap — 2026-10-16

BTC ETH Daily Recap — 2026-10-16
Today at a Glance
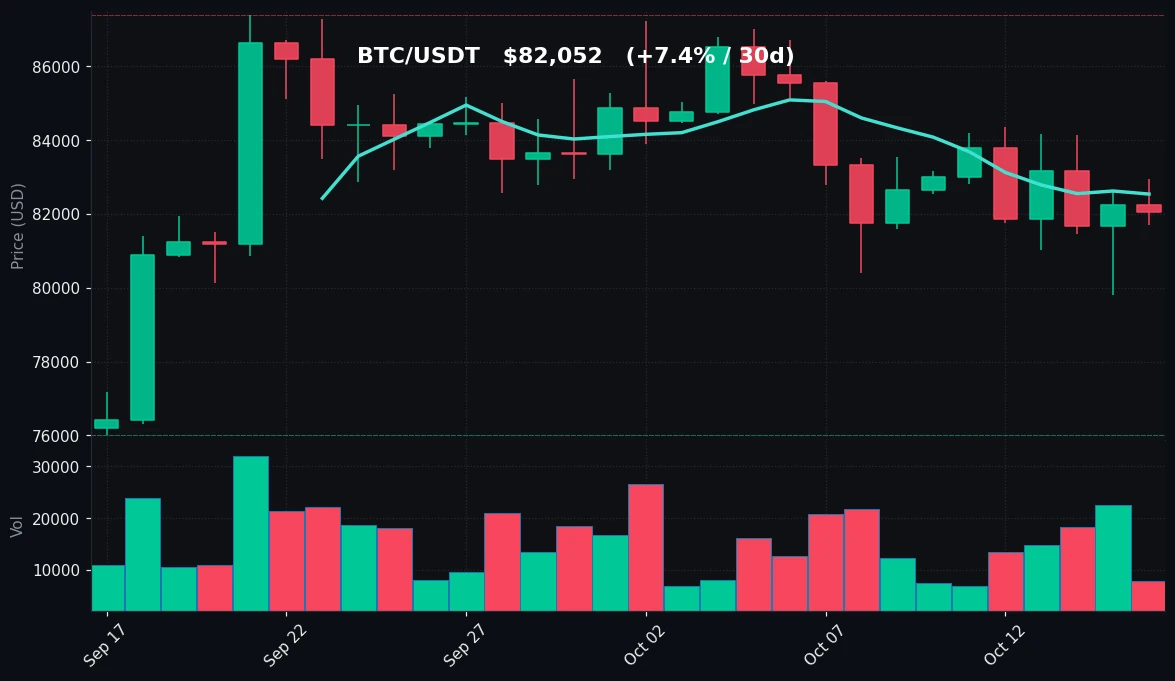
Bitcoin is trading at $82,052, essentially flat over the past 24 hours at -0.24%, with an intraday range of $81,688 to $82,941. The muted daily move extends a softer weekly stretch: BTC is down 0.71% over seven days, though it remains up 7.37% over 30 days. Price is currently sitting below both its 7-day moving average ($82,537) and its 30-day moving average ($83,421), while RSI(14) at 41.4 leans toward the weaker side of neutral. Volume is running at just 0.58x the 7-day average, indicating thin participation.
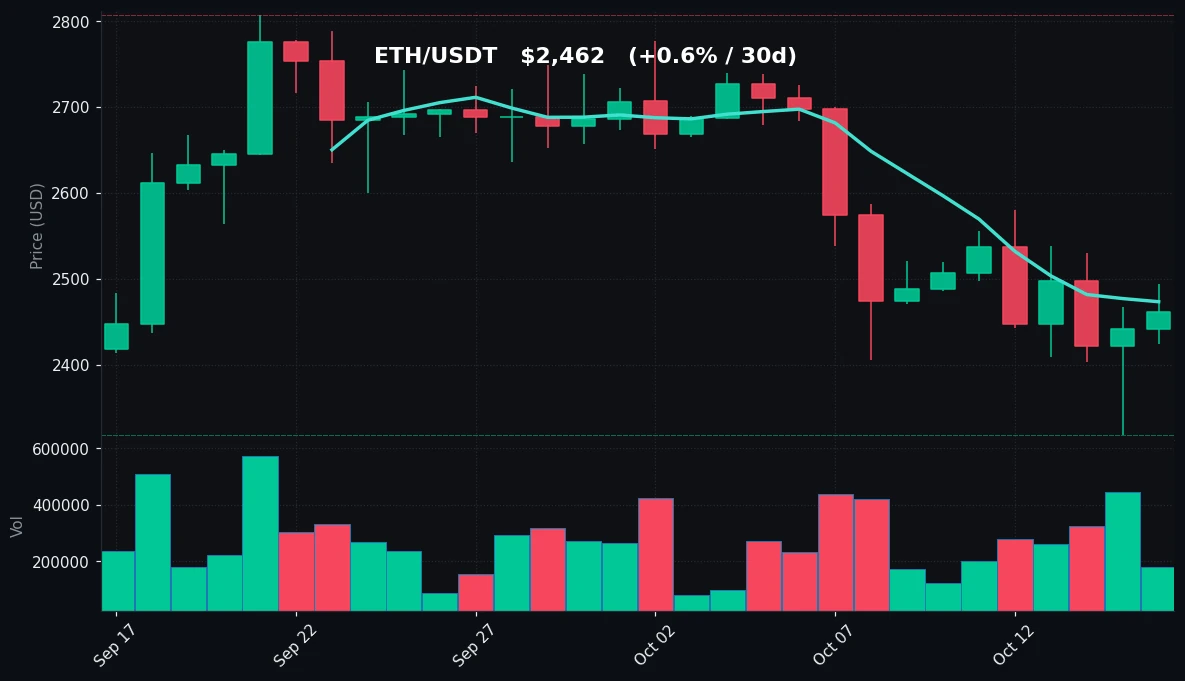
Ethereum is holding up slightly better on the day, up 0.81% to $2,462, with a 24-hour range of $2,425 to $2,494. Over seven days ETH is down 1.04% and roughly flat over 30 days at +0.60%. ETH trades marginally below its 7-day MA ($2,473) and well below its 30-day MA ($2,614), with RSI(14) at 33.6 — approaching oversold territory. Volume is also light at 0.69x the 7-day average.
Bitcoin Analysis
TradingView Live (4h)
Bitcoin's daily structure remains constructive on a medium-term basis but is currently in a consolidation phase. The 30-day gain of 7.37% stands in contrast to the 0.71% decline over the past week, suggesting that the bulk of the recent advance occurred earlier in the monthly window and has since given way to sideways-to-lower drift. The 30-day high of $87,396 marks the upper boundary of that advance, while the 30-day low of $76,000 defines the base from which the move originated. Within the past week, price has oscillated between $79,800 and $84,352, a range of roughly $4,550, which frames the current battleground.
On the moving averages, BTC is trading below both the MA7 at $82,537 and the MA30 at $83,421. This positioning — price beneath two closely clustered short- and medium-term averages — signals that momentum has cooled and that recent buyers are, on average, slightly underwater. The gap between the two averages is narrow (about $884), which often accompanies a compression phase where trend direction is unresolved. Notably, the MA30 sits above the MA7, a configuration consistent with a short-term pullback within a broader range rather than a confirmed downtrend.
RSI(14) at 41.4 is below the 50 midline but comfortably above the 30 oversold threshold. This places momentum in a mildly negative but not stretched condition, meaning there is room for further softening without triggering classic oversold signals. Traders watching mean-reversion setups would typically want to see RSI push toward or below 30 before treating a bounce as technically compelling.
Volume is the standout detail today: at 0.58x the 7-day average, participation is notably light. Low-volume sessions can produce misleading price signals, as thin order books amplify moves in either direction. The combination of a narrow daily range (-0.24%, with a high-low spread of about $1,253) and depressed volume points to a market in wait-and-see mode rather than one undergoing aggressive repositioning.
Key levels to monitor on the downside include the 7-day low at $79,800, followed by the 30-day low at $76,000. On the upside, the 7-day high at $84,352 and the 30-day high at $87,396 form the nearest resistance zones. The MA7 and MA30, sitting at $82,537 and $83,421 respectively, act as intermediate pivots — reclaiming them would shift the short-term posture back toward neutral-to-positive.
Ethereum Analysis
TradingView Live (4h)
Ethereum's picture is one of relative underperformance against a longer backdrop, paired with a modest daily bounce. ETH is up 0.81% over 24 hours to $2,462, but down 1.04% on the week and only +0.60% over 30 days. The 30-day range is wide: a high of $2,807 against a low of $2,318 — a spread of nearly $490, or roughly 21% of the current price. That the 7-day low ($2,318) matches the 30-day low indicates ETH recently tested the bottom of its monthly range and has since recovered modestly.
The moving average structure is clearly bearish in the short term. ETH trades just below its MA7 at $2,473 — a gap of only about $11 — but far below its MA30 at $2,614, a discount of roughly $152, or about 6%. The wide separation between the two averages reflects the sharp decline from the 30-day high and the subsequent failure to reclaim the medium-term mean. For the trend to neutralize, ETH would first need to establish a foothold above the MA7 and then challenge the MA30.
RSI(14) at 33.6 is the most notable technical reading on the board today. It sits in the lower reaches of neutral and is edging toward the 30 oversold line. This suggests selling pressure has been persistent, though not yet at the extreme levels that historically accompany capitulation-style reversals. Momentum traders often treat sub-35 RSI readings as a warning that downside may be mature, but not necessarily exhausted.
Volume at 0.69x the 7-day average is light, though slightly firmer than BTC's relative reading. The daily range of $2,425 to $2,494 is moderate — about $69, or 2.8% — indicating some intraday two-way activity despite the subdued turnover. The +0.81% close is a modest positive, but it comes after a weekly decline, so it reads more as stabilization than reversal.
Key downside levels: the $2,425 daily low, then the $2,318 zone that marks both the 7-day and 30-day low — a confluence that makes it the most significant support on the chart. On the upside, the 7-day high at $2,580 is the first hurdle, followed by the 30-day high at $2,807. The MA7 at $2,473 is the immediate pivot; a sustained hold above it would be the first sign of short-term repair.
Key Technical Levels
| Asset | Support | Resistance | RSI |
|---|---|---|---|
| BTC | $79,800 (7d low) / $76,000 (30d low) | $84,352 (7d high) / $87,396 (30d high) | 41.4 — neutral, leaning weak |
| ETH | $2,425 (24h low) / $2,318 (7d & 30d low) | $2,580 (7d high) / $2,807 (30d high) | 33.6 — neutral, approaching oversold |
BTC vs ETH Dynamic
BTC and ETH are broadly moving in tandem, but with a notable divergence in relative strength. Bitcoin's 30-day gain of 7.37% contrasts sharply with Ethereum's +0.60%, indicating that capital has favored BTC over the past month. On the day, the relationship flips slightly — ETH's +0.81% versus BTC's -0.24% — which is consistent with a modest rotation or short-covering bounce in the weaker asset rather than a change in the broader trend. Both assets share the same structural traits today: price below both the MA7 and MA30, RSI in the lower-neutral band, and volume well below the 7-day average. The correlation remains high in direction, but the magnitude gap suggests ETH is carrying a higher beta to the downside during this consolidation phase.
Strategy Fit
Today's conditions — compressed daily ranges, sub-average volume, RSI in neutral-to-weak territory, and price oscillating between well-defined weekly highs and lows — are characteristic of a range-bound market rather than a trending one. In such environments, grid strategies, which profit from repeated oscillation within a defined band, tend to fit the tape better than trend-following approaches that require sustained directional movement. Dollar-cost averaging (DCA) also remains a reasonable framework for longer-horizon participants given that both assets are trading below their 30-day averages and ETH's RSI is approaching oversold. Trend strategies, by contrast, would typically want to see volume expansion and a decisive reclaim of the MA30 before offering a clean signal. Pionex's built-in bots — including grid trading bots, DCA bots, and trend-following bots — are designed to automate these approaches, allowing users to set parameters around the support and resistance zones identified above. As always, strategy selection should match individual risk tolerance and time horizon.
Risk Disclaimer
This content is for informational purposes only and does not constitute financial, investment, or trading advice. Cryptocurrency markets are highly volatile and can result in the total loss of capital. The technical levels and observations discussed are based on historical price data and do not predict future outcomes. Always conduct your own research and consult a qualified professional before making any investment decisions.
FAQ
What was Bitcoin's price on 2026-10-16?
BTC/USDT was trading at $82,052, down 0.24% over 24 hours, with an intraday high of $82,941 and low of $81,688.
How did Ethereum perform on the day?
ETH/USDT rose 0.81% to $2,462, with a 24-hour range between $2,425 and $2,494.
What do the RSI readings indicate?
BTC's RSI(14) is 41.4 and ETH's is 33.6. Both sit below the 50 midline, indicating weak momentum, with ETH closer to the 30 oversold threshold.
Are BTC and ETH above or below their moving averages?
Both are below their 7-day and 30-day moving averages. BTC's MA7 is $82,537 and MA30 is $83,421; ETH's MA7 is $2,473 and MA30 is $2,614.
What are the key support and resistance zones?
For BTC, support sits at $79,800 and $76,000, with resistance at $84,352 and $87,396. For ETH, support is at $2,425 and $2,318, with resistance at $2,580 and $2,807.


