BTC ETH Daily Recap — 2026-10-19

BTC ETH Daily Recap — 2026-10-19
Today at a Glance
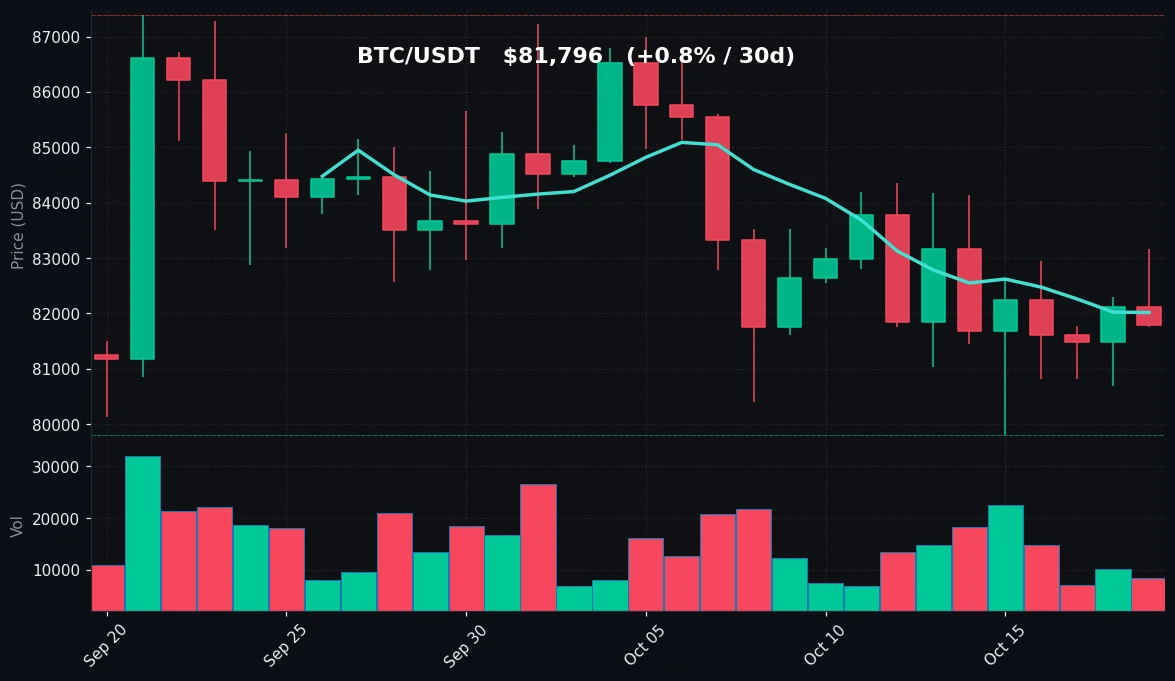
Bitcoin is trading at $81,796, down -0.39% over the past 24 hours within a narrow range of $81,762–$83,158. The weekly change is essentially flat at -0.07%, while the 30-day figure remains modestly positive at +0.76%. Price is sitting below both the MA7 ($82,016) and MA30 ($83,635), and RSI(14) at 34.8 places momentum in the lower-neutral zone. Volume is running at just 0.58x the 7-day average, signaling muted participation.
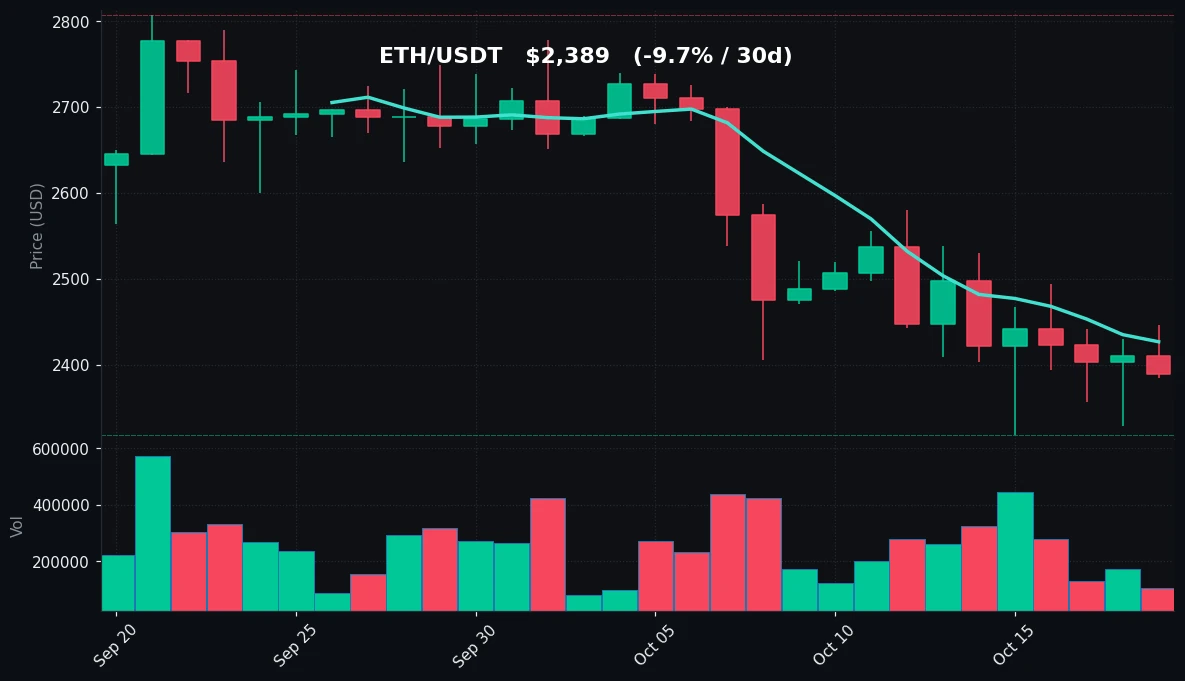
Ethereum is weaker at $2,389, down -0.89% on the day after trading between $2,385 and $2,446. The 7-day decline is -2.38% and the 30-day drawdown is -9.69%. ETH trades well below its MA7 ($2,427) and MA30 ($2,596), with RSI(14) at 23.4 — technically in oversold territory. Volume at 0.39x the 7-day average is notably thin, suggesting limited conviction behind the move.
Bitcoin Analysis
TradingView Live (4h)
Bitcoin's structure on the daily timeframe remains range-bound and slightly defensive. Price at $81,796 is positioned in the lower half of the 30-day envelope defined by a high of $87,396 and a low of $79,800. The 7-day range is tighter — $79,800 to $84,168 — and the current price sits roughly in the middle of that band, closer to the lower quartile. The key observation is that BTC has repeatedly held the $79,800 region, which now stands as the defining support of the recent consolidation. A failure to hold that level would break the pattern of higher lows established over the past month.
On the moving averages, the picture is mildly bearish in the short term. The MA7 at $82,016 is above spot, and the MA30 at $83,635 is above both. This stacked configuration — price below MA7 below MA30 — indicates that recent momentum has faded relative to the monthly trend. However, the gap between spot and MA30 is only about 2.2%, which is modest and consistent with consolidation rather than a decisive trend reversal. The MA30 itself has been flattening, reflecting the absence of directional conviction.
Momentum readings support a neutral-to-soft bias. RSI(14) at 34.8 is below the midline but still above the 30 threshold that conventionally marks oversold. This means BTC has room to drift lower without triggering oversold conditions, but it also means selling pressure has not reached exhaustion levels typically associated with capitulation. The RSI has been trending in the 30s–40s band, consistent with a market that is consolidating rather than trending.
Volume is the most telling input today. At 0.58x the 7-day average, participation is well below normal. Low-volume pullbacks are generally interpreted as a lack of aggressive selling rather than strong distribution. The 24-hour range of roughly $1,396 (high minus low) is compressed relative to the 7-day range of $4,368, confirming a quiet session. In range-bound conditions with declining volume, price tends to gravitate toward the middle of the range absent a catalyst.
Key technical levels to monitor: support at $79,800 (7-day and 30-day low), with a secondary zone around $81,000–$81,700 where recent intraday lows have clustered. Resistance sits at $83,158 (24h high), then $84,168 (7-day high), with the MA30 at $83,635 acting as a dynamic ceiling in between. A close above the MA30 would be the first structural improvement; a close below $79,800 would invalidate the consolidation floor.
Ethereum Analysis
TradingView Live (4h)
Ethereum's technical picture is materially weaker than Bitcoin's. At $2,389, ETH is down -0.89% on the day, -2.38% on the week, and -9.69% over 30 days. The 30-day range spans $2,318 to $2,807, and price is trading near the bottom of that envelope — only about 3% above the 30-day low. The 7-day range of $2,318–$2,539 tells the same story: ETH is pressing against the lower boundary of its recent range.
The moving average structure is decisively bearish. Spot at $2,389 is below the MA7 at $2,427 and far below the MA30 at $2,596 — a gap of roughly 8.7% to the monthly average. The MA7 is also below the MA30, confirming a downtrend on the intermediate timeframe. Unlike BTC, where the MA30 gap is narrow, ETH's distance from its monthly mean indicates that the recent decline has been sustained rather than a brief dip.
RSI(14) at 23.4 is the standout data point. This is firmly in oversold territory, below the 30 threshold. In technical terms, oversold readings indicate that the pace of recent declines has been steep relative to the prior advance, and they often coincide with short-term bounce attempts — though oversold conditions can persist in strong downtrends. What matters here is the combination: deeply oversold RSI plus very thin volume.
Volume at 0.39x the 7-day average is exceptionally low — less than 40% of normal participation. This is a critical nuance. A decline on shrinking volume suggests the move is being driven by a lack of bids rather than heavy selling. It also means the oversold signal carries less weight than it would on expanding volume, because there is no evidence of climactic capitulation. Thin markets can move sharply in either direction on modest order flow.
Key technical levels: support at $2,318 (the 7-day and 30-day low, a confluence level), with the psychological $2,300 round number just below. Resistance is layered — first the MA7 at $2,427, then the 24-hour high at $2,446, then the 7-day high at $2,539, and finally the MA30 at $2,596. For any recovery to be technically meaningful, ETH would need to reclaim the MA7 and hold above $2,446; until then, the path of least resistance remains lower within the established range.
The relative weakness versus BTC is notable: ETH's 30-day drawdown of -9.69% compares with BTC's +0.76%, a performance spread of more than 10 percentage points. This divergence is reflected in the RSI gap — 23.4 versus 34.8 — and suggests capital rotation away from ETH toward BTC or stable assets during this period.
Key Technical Levels
| Asset | Support | Resistance | RSI |
|---|---|---|---|
| BTC | $79,800 (30d low); $81,000–$81,700 (intraday cluster) | $83,158 (24h high); $83,635 (MA30); $84,168 (7d high) | 34.8 — neutral, approaching oversold |
| ETH | $2,318 (7d/30d low); $2,300 (psychological) | $2,427 (MA7); $2,446 (24h high); $2,539 (7d high); $2,596 (MA30) | 23.4 — oversold |
BTC vs ETH Dynamic
The BTC–ETH relationship today shows a clear risk-aversion tilt within crypto. BTC is essentially flat over 30 days (+0.76%) while ETH has shed nearly a tenth of its value (-9.69%), and the daily moves — -0.39% versus -0.89% — extend the same pattern. Both assets are trading below their MA7 and MA30, so the correlation in direction remains intact, but the magnitude diverges sharply. ETH's RSI at 23.4 versus BTC's 34.8 quantifies the relative weakness: ETH is absorbing the larger share of selling pressure. Volume ratios reinforce this — BTC at 0.58x and ETH at 0.39x both indicate subdued activity, but ETH's thinner participation means its price is more sensitive to marginal flows. In practice, this configuration — BTC holding a range while ETH grinds toward range lows — is characteristic of defensive positioning where traders favor the larger, more liquid asset. The correlation remains high in sign but has widened in spread; a stabilization in ETH would likely require BTC to first reclaim its MA30 at $83,635, since ETH has historically lacked the independent momentum to lead a reversal.
Strategy Fit
Today's conditions — compressed ranges, below-average volume, and divergent momentum between the two majors — favor range-aware approaches over directional trend-following. BTC's tight 24-hour range ($81,762–$83,158) and neutral RSI make it a candidate for grid strategies, which profit from oscillation within defined boundaries; a grid set between the $79,800 support and $84,168 resistance would capture the current consolidation. ETH's oversold RSI at 23.4 combined with very thin volume (0.39x) argues for a measured DCA approach rather than aggressive accumulation, since oversold conditions can persist and volume offers no confirmation of a bottom. Trend-following strategies are poorly suited to both assets today: BTC is below its moving averages without a decisive breakdown, and ETH is in a downtrend but on fading volume — neither offers the clean momentum signature that trend systems require.
For traders implementing these approaches, Pionex's built-in bots map directly onto this environment: the Grid Trading Bot for BTC's range-bound behavior, the DCA Bot for staggered ETH entries, and the Smart Trade tool for setting defined support/resistance exits. Position sizing should reflect the low-liquidity backdrop, as thin order books can amplify slippage.
Risk Disclaimer
This recap is provided for informational purposes only and does not constitute financial advice, investment recommendation, or an offer to buy or sell any asset. Cryptocurrency markets are highly volatile and can result in total loss of capital. Technical indicators such as RSI and moving averages describe past price behavior and do not predict future outcomes. Past performance is not indicative of future results. Readers should conduct independent research and consult a qualified financial professional before making any investment decisions. The author holds no position in the assets discussed.
FAQ
What does BTC's RSI of 34.8 indicate?
It places BTC in neutral territory, below the midline but above the conventional oversold threshold of 30. Momentum is soft but not exhausted.
Why is ETH's RSI at 23.4 significant?
Readings below 30 are considered oversold, indicating the recent decline has been steep. However, oversold conditions can persist, especially on thin volume, so the signal alone does not confirm a reversal.
What are the key support levels for both assets?
BTC's primary support is $79,800, the 7-day and 30-day low. ETH's primary support is $2,318, also a 7-day and 30-day low, with $2,300 as a psychological level below.
How does today's volume compare to normal?
Both assets are trading well below average: BTC at 0.58x and ETH at 0.39x the 7-day average. Low volume suggests reduced conviction and limited participation.
Which strategy types suit current conditions?
Range-bound grid strategies fit BTC's consolidation, while measured DCA suits ETH's oversold but unconfirmed setup. Trend-following is less suited given the absence of clear directional momentum. Pionex offers built-in bots for each of these approaches.


