BTC ETH Daily Recap — 2026-10-20

BTC ETH Daily Recap — 2026-10-20
Today at a Glance
Bitcoin and Ethereum both closed modestly higher over the past 24 hours, but the bounce does little to change a soft medium-term picture. BTC printed $82,379, up +0.54% on the day within a narrow $81,200–$82,447 range, yet remains -0.95% over seven days and -4.90% over 30 days. ETH traded at $2,421, +0.52% in 24 hours, but is down -3.10% week-over-week and -12.81% over the month — a notably deeper drawdown than BTC. Volume is the story beneath the surface: BTC volume sits at just 0.53x its 7-day average and ETH at 0.40x, indicating thin participation behind the green candles. Momentum readings diverge sharply — BTC's RSI(14) at 37.9 is weak but not stretched, while ETH's 26.3 is firmly in oversold territory. Both assets remain below their 30-day moving averages ($83,680 for BTC, $2,589 for ETH), keeping the broader structure corrective.
Bitcoin Analysis
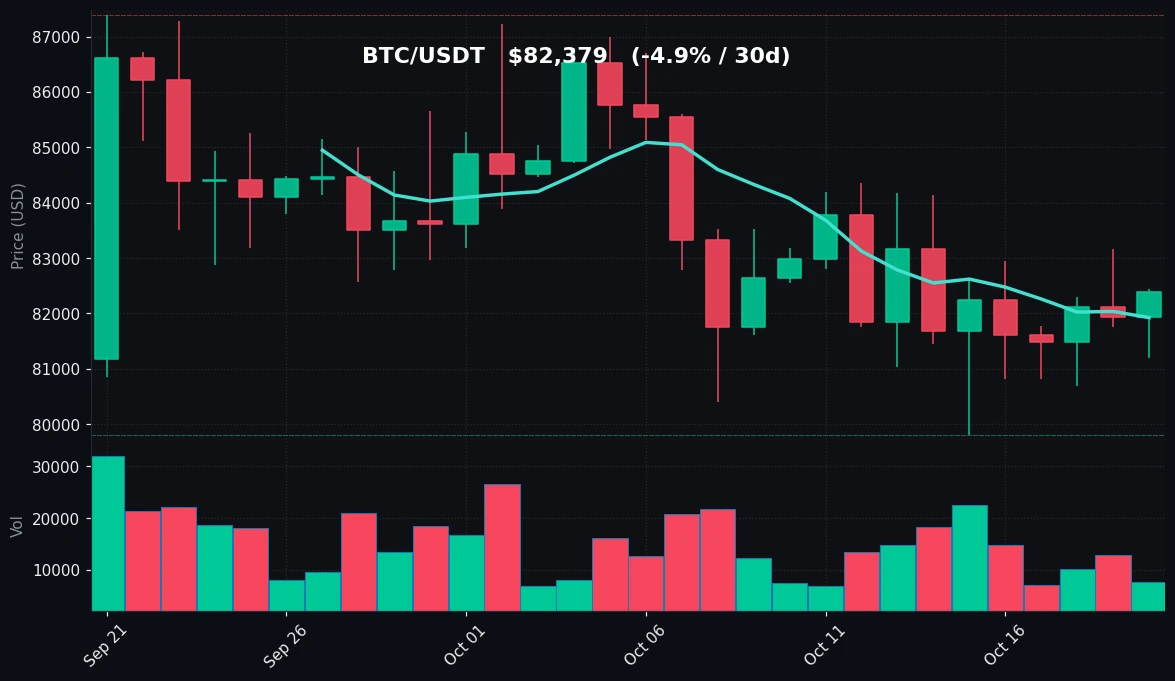
TradingView Live (4h)
Bitcoin's trend structure remains corrective on the higher timeframes. Price at $82,379 is trading below the 30-day moving average of $83,680 but above the 7-day moving average of $81,924 — a configuration that describes a market consolidating after a pullback rather than one in active recovery. The 30-day range tells the fuller story: BTC peaked at $87,396 within the month and bottomed at $79,800, and current prices sit in the lower-middle portion of that band. The 7-day high of $84,147 marks the most recent failed push toward the 30-day MA, while the 7-day low of $79,800 coincides with the monthly low — a level that has now been tested and held at least once.
On the daily session, the range was tight: a low of $81,200 and a high of $82,447, a spread of roughly 1.5%. That compression, combined with volume at only 0.53x the 7-day average, suggests neither buyers nor sellers are committing size. Low-volume drift higher is generally a weak signal — it reflects absence of selling pressure more than conviction from buyers. The immediate resistance zone sits at the 7-day MA around $81,924 (already reclaimed) and then the $83,680 30-day MA, which aligns closely with the recent $84,147 swing high. Support is defined by the $81,200 session low, with the more significant floor at $79,800.
Momentum is soft but not capitulatory. RSI(14) at 37.9 sits below the neutral 50 line, consistent with a market that has lost upward momentum but has not reached oversold conditions. There is room for further weakness before momentum extremes would suggest exhaustion. The neutral read: BTC is range-bound between roughly $79,800 and $84,147, with the 30-day MA as the pivot that separates consolidation from a more constructive structure. No directional conclusion is warranted from a single low-volume session.
Ethereum Analysis
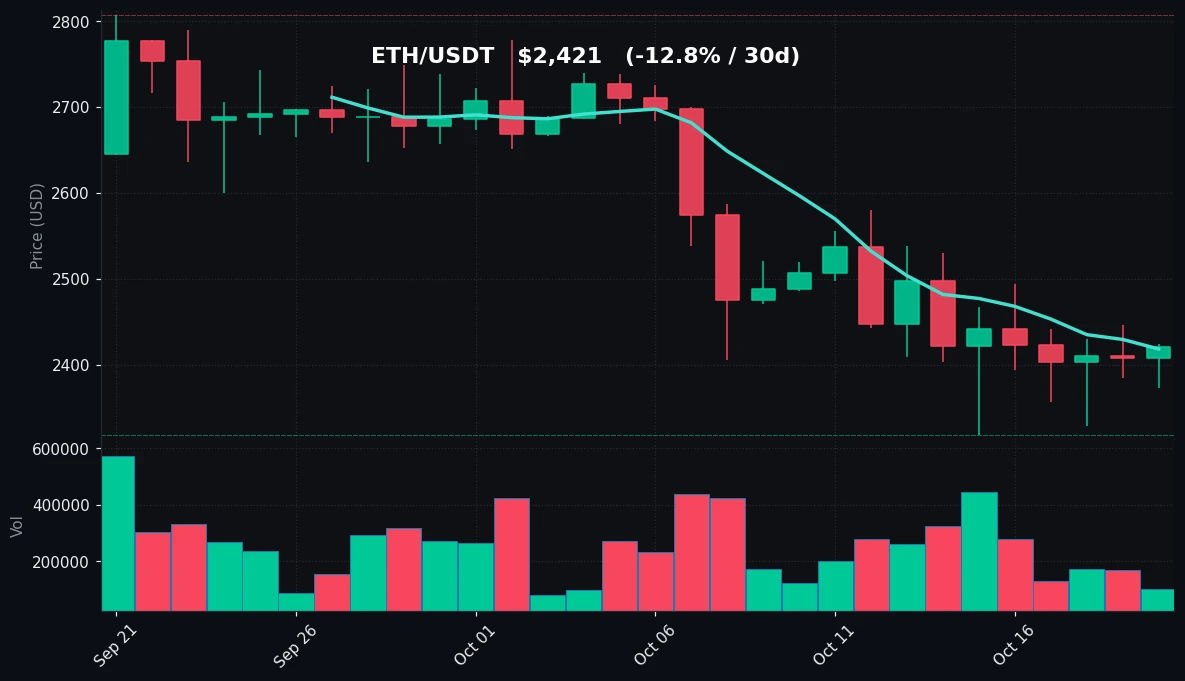
TradingView Live (4h)
Ethereum's technical picture is weaker than Bitcoin's on nearly every measure. At $2,421, ETH trades essentially at its 7-day moving average of $2,418 — a coin-flip level — but well below the 30-day MA of $2,589, a gap of roughly 6.5%. The 30-day performance of -12.81% is more than double BTC's -4.90% decline over the same window, and the 7-day drop of -3.10% versus BTC's -0.95% confirms ETH is leading to the downside.
The range data reinforces this. ETH's 30-day high of $2,807 and low of $2,318 place the current price in the bottom quarter of the monthly band. Notably, the 7-day low of $2,318 is identical to the 30-day low — meaning the monthly floor was set within the past week, and price has only bounced about 4.4% off it. The 7-day high of $2,530 represents the recent rejection point and sits just below the 30-day MA. Today's session was narrow: $2,373 to $2,425, with the close near the top of that range.
The standout data point is RSI(14) at 26.3 — below the 30 threshold and in oversold territory. This is a meaningful divergence from BTC's 37.9. Oversold readings indicate sustained selling pressure has persisted; they do not, on their own, signal a reversal. Combined with volume at just 0.40x the 7-day average — the thinnest participation in this report — the oversold condition is occurring on declining activity, which often characterizes the tail end of a move rather than its continuation, though confirmation would require a volume-backed shift.
Key levels for ETH: support at $2,318 (the coincident 7-day and 30-day low), with the $2,373 session low as the first intraday line. Resistance begins at the $2,530 7-day high, followed by the $2,589 30-day MA. ETH remains the higher-beta, weaker leg of the pair.
Key Technical Levels
| Asset | Support | Resistance | RSI |
|---|---|---|---|
| BTC | $79,800 (30d low) / $81,200 (session low) | $83,680 (MA30) / $84,147 (7d high) | 37.9 — neutral, weak |
| ETH | $2,318 (7d & 30d low) / $2,373 (session low) | $2,530 (7d high) / $2,589 (MA30) | 26.3 — oversold |
BTC vs ETH Dynamic
The pair remains tightly correlated in direction but clearly divergent in magnitude. Both assets printed green 24-hour candles of nearly identical size (+0.54% BTC, +0.52% ETH) and both traded on unusually thin volume, yet their weekly and monthly performance separates them decisively: ETH's -12.81% 30-day drawdown is roughly 2.6x BTC's -4.90%. This is the classic high-beta relationship in a risk-off phase — ETH amplifies BTC's moves in both directions, and with BTC drifting lower, ETH has absorbed the larger share of the selling. The RSI spread (37.9 vs 26.3) is the clearest expression of this: ETH is doing the oversold work while BTC merely leans weak. For rotation watchers, the setup implies that any BTC stabilization would likely produce a sharper percentage rebound in ETH, while continued BTC softness would likely press ETH toward its $2,318 floor first. Correlation in direction, asymmetry in magnitude — that is the defining dynamic today.
Strategy Fit
Today's conditions — compressed ranges, sub-average volume, and a market oscillating within defined bands — favor range-aware approaches over directional trend-following. BTC's confinement between $79,800 and $84,147, and ETH's between $2,318 and $2,530, create structured boundaries that suit grid-style strategies, which profit from oscillation within a defined channel rather than from a sustained breakout. The low volume argues against aggressive trend entries in either direction, since momentum signals on thin participation are prone to false starts. For longer-horizon holders, the oversold ETH reading and BTC's mid-range position make systematic accumulation — dollar-cost averaging at fixed intervals — a rational way to average into positions without timing risk. Pionex offers built-in bots that map directly to these conditions: Grid Trading bots for the range-bound setup, DCA bots for systematic accumulation, and a range of other automated strategies accessible without external tooling. Position sizing and bot parameters should reflect the narrow ranges and the possibility of a boundary break. This is a description of strategy fit, not a recommendation to deploy capital.
Risk Disclaimer
This recap is provided for informational and educational purposes only. It does not constitute financial advice, investment advice, trading advice, or a recommendation to buy or sell any asset. Cryptocurrency markets are highly volatile and can result in the total loss of capital. Past performance and technical indicators are not reliable predictors of future results. All levels, readings, and observations cited are as of 2026-10-20 and are subject to rapid change. Readers should conduct their own research and consult a qualified financial professional before making any investment decision. The author holds no position in the assets discussed.
FAQ
What were BTC and ETH's 24-hour moves on 2026-10-20?
BTC rose +0.54% to $82,379 within a $81,200–$82,447 range. ETH rose +0.52% to $2,421 within a $2,373–$2,425 range.
Why is ETH's RSI reading significant today?
ETH's RSI(14) is 26.3, placing it in oversold territory below the 30 threshold, compared with BTC's 37.9. This reflects sustained selling pressure and a deeper drawdown — ETH is -12.81% over 30 days versus BTC's -4.90%.
What do the volume figures indicate?
BTC volume is 0.53x its 7-day average and ETH is 0.40x. Both are well below normal, indicating thin participation — the modest gains occurred on light activity rather than strong conviction.
What are the key levels to watch?
For BTC, support at $79,800 and resistance at $83,680 (MA30) / $84,147. For ETH, support at $2,318 and resistance at $2,530 / $2,589 (MA30).
Which strategy types suit the current market structure?
With both assets range-bound on low volume, grid strategies fit the defined channels and DCA suits systematic accumulation. Pionex's built-in bots cover both approaches. This is informational, not financial advice.


