BTC ETH Daily Recap — 2026-10-21

BTC ETH Daily Recap — 2026-10-21
Today at a Glance
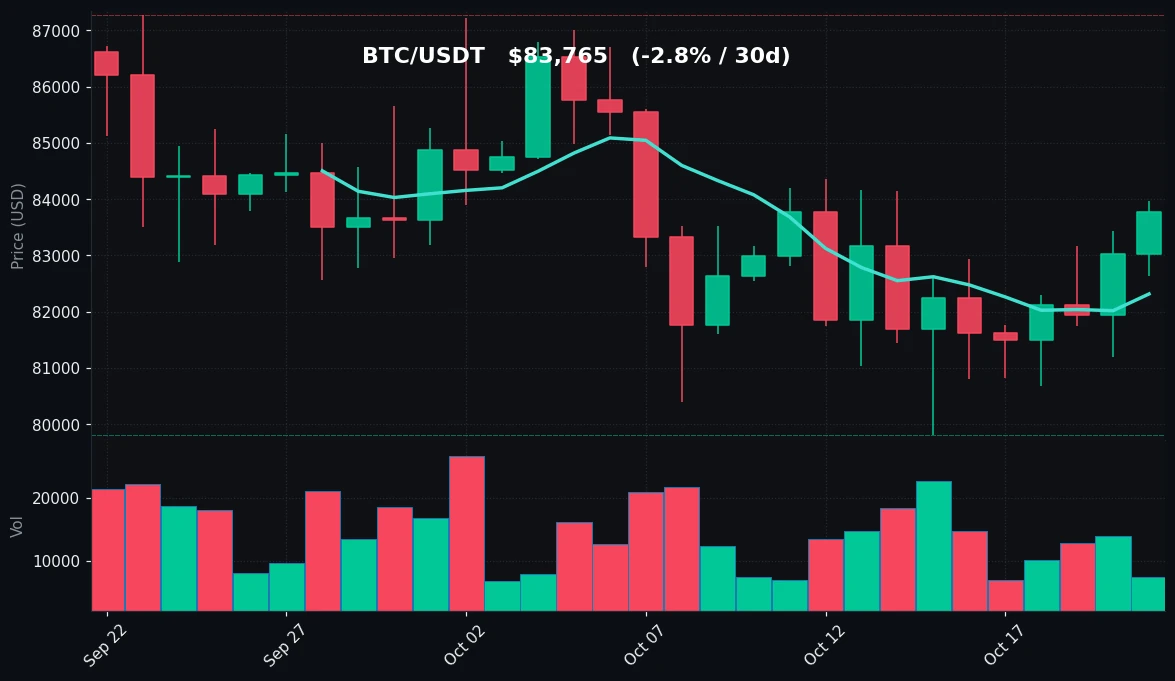
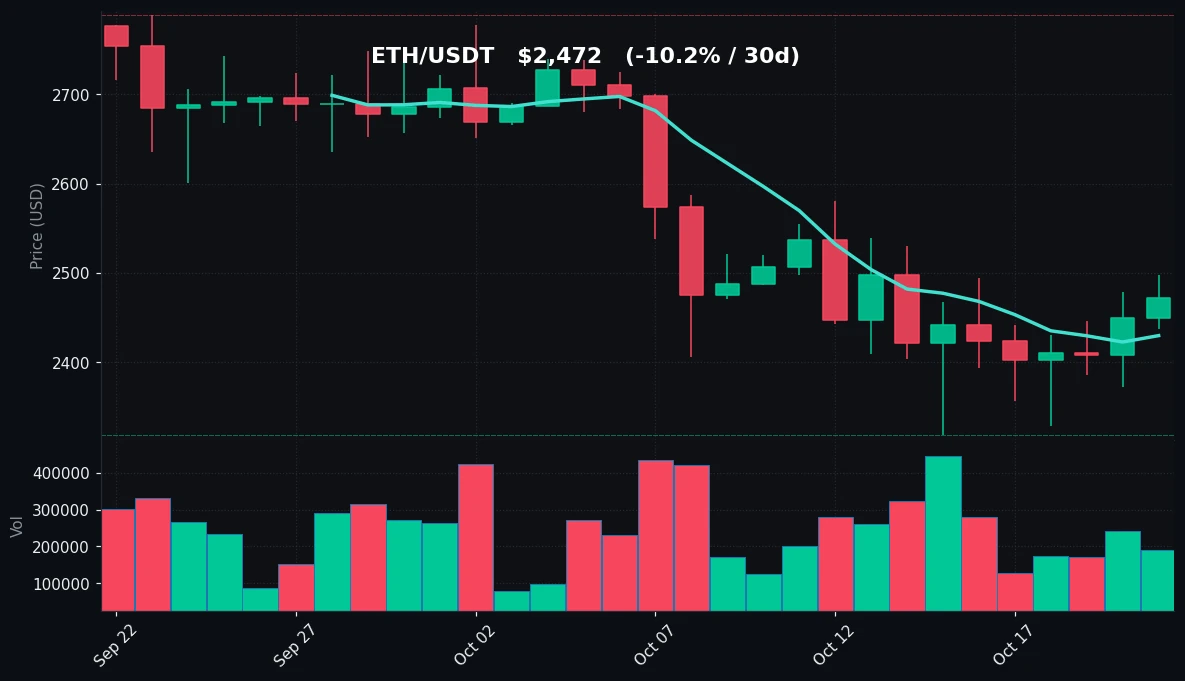
Bitcoin and Ethereum both extended modest gains over the past 24 hours, with BTC adding +0.89% to trade at $83,765 and ETH rising +0.93% to $2,472. The two majors remain in a short-term recovery phase on the weekly timeframe — BTC is up +2.55% over 7 days and ETH +2.08% — but the monthly picture is still soft, with BTC down -2.84% and ETH down a steeper -10.23% over 30 days. BTC's daily range was contained between $82,635 and $83,969, while ETH oscillated between $2,437 and $2,498. Notably, volume is running well below the 7-day average for both assets (BTC at 0.52x, ETH at 0.76x), signaling a low-conviction tape. BTC sits marginally below its 30-day moving average ($83,606), while ETH remains meaningfully below its 30-day MA ($2,580) despite reclaiming its 7-day MA.
Bitcoin Analysis
TradingView Live (4h)
BTC's price structure on the daily chart shows a market that has stabilized after a corrective phase but has not yet confirmed a trend reversal. The 7-day high of $83,969 — which was effectively retested as today's 24-hour high — now acts as the immediate ceiling, while the 7-day low of $79,800 coincides with the 30-day low, marking a clear demand zone where buyers previously stepped in. Price is trading above the 7-day moving average of $82,314 but just below the 30-day MA of $83,606, a configuration that typically reflects a market in transition: short-term momentum has turned constructive, but the medium-term trend remains neutral-to-soft.
The moving average relationship is the key technical tell today. BTC has reclaimed its 7-day MA decisively, and the gap between the 7-day ($82,314) and 30-day ($83,606) averages has narrowed to roughly $1,300 — a compression that suggests the recent downtrend is losing energy. A sustained hold above the 30-day MA would be the first structural improvement in weeks; failure to clear it keeps the $79,800–$82,300 band in play as the operative range.
RSI(14) at 51.8 places BTC squarely in neutral territory — neither overbought nor oversold. This is consistent with a market that has worked off oversold conditions from the recent dip to $79,800 but lacks the momentum impulse to break out. The RSI has room to move in either direction, which reinforces the range-bound read rather than a directional one.
Volume is the most notable caveat. At 0.52x the 7-day average, participation is roughly half of recent norms. Low-volume advances are historically less reliable than volume-confirmed moves, and this raises the risk that the current grind higher is a drift rather than accumulation. The 30-day high of $87,279 remains the reference point for any medium-term bullish resolution, but it is well above current price and not an immediate concern. For now, BTC is best characterized as consolidating in a defined range with neutral momentum and thin participation — a tape that rewards patience over conviction.
Ethereum Analysis
TradingView Live (4h)
ETH's chart presents a weaker structural picture than BTC's, even though the 24-hour percentage gain is comparable. At $2,472, ETH is above its 7-day moving average of $2,430 but substantially below its 30-day MA of $2,580 — a gap of roughly $108, or about 4.2%. That spread is far wider than BTC's sub-2% gap between its 7-day and 30-day averages, and it tells the core story: ETH's medium-term trend remains clearly negative even as short-term price action stabilizes.
The 30-day performance figures confirm this divergence. ETH is down -10.23% over the month versus BTC's -2.84%, and its 30-day high of $2,789 is roughly 12.8% above current price — a much deeper drawdown from the monthly peak than BTC's ~4% decline from its 30-day high of $87,279. The recent low of $2,318, which also marks the 7-day low, is the critical support reference; price has bounced approximately 6.6% off that level, but the bounce has been orderly rather than impulsive.
RSI(14) at 40.0 is the standout data point. ETH is in the lower-neutral zone, approaching but not reaching oversold territory. This is meaningfully weaker than BTC's 51.8 and reflects the relative underperformance: ETH has not yet recovered enough momentum to lift its RSI back above the midline. In practical terms, ETH has more room to fall before hitting oversold conditions, and its RSI recovery lag suggests buyers remain cautious.
Volume at 0.76x the 7-day average is above BTC's relative participation but still below normal. The 24-hour range of $2,437–$2,498 was tight, and the close near the upper end of that range is a modest positive. The immediate resistance cluster sits at the 30-day MA ($2,580), with the 7-day high of $2,498 as the first hurdle. Support rests at the $2,430 7-day MA and, below that, the $2,318 swing low. ETH's setup is a recovery attempt within a still-intact downtrend — constructive on the day, unproven on the month.
Key Technical Levels
| Asset | Support | Resistance | RSI |
|---|---|---|---|
| BTC | $82,314 (7-day MA) / $79,800 (30-day low) | $83,606 (30-day MA) / $83,969 (7-day high) | 51.8 — neutral |
| ETH | $2,430 (7-day MA) / $2,318 (30-day low) | $2,498 (7-day high) / $2,580 (30-day MA) | 40.0 — neutral (lower zone) |
BTC vs ETH Dynamic
BTC and ETH are moving in the same direction today with near-identical 24-hour gains (+0.89% vs +0.93%), confirming that the short-term correlation remains high and that both assets are responding to the same macro liquidity impulse. However, the correlation breaks down on longer horizons: BTC is down -2.84% over 30 days while ETH is down -10.23%, a performance gap of roughly 7.4 percentage points. This divergence is mirrored in the moving-average structures — BTC trades just below its 30-day MA while ETH sits more than 4% below its own — and in RSI, where BTC's 51.8 versus ETH's 40.0 shows ETH carrying materially weaker momentum. The practical read is that ETH is exhibiting higher beta to the downside in this cycle: it fell harder and is recovering more slowly. For traders, this means BTC remains the cleaner technical setup for range or trend strategies, while ETH offers more mean-reversion potential but with greater risk of continued relative weakness. Correlation is high on the day but the relative-strength spread is the more important signal.
Strategy Fit
Today's tape — low volume (BTC 0.52x, ETH 0.76x), neutral RSI on BTC, lower-neutral RSI on ETH, and both assets pinned between well-defined 7-day and 30-day moving averages — is a classic range environment rather than a trending one. In such conditions, grid strategies tend to fit best: they monetize oscillation within the $79,800–$83,969 BTC band and the $2,318–$2,580 ETH band without requiring a directional breakout. Pionex's built-in grid bots are designed for exactly this setup, automatically placing buy and sell orders across a defined range so that sideways chop generates repeated small profits. For longer-horizon holders, a DCA approach remains reasonable given BTC's neutral RSI and ETH's approach toward oversold, allowing accumulation without timing risk. Trend-following strategies are the least suited today: with volume at roughly half of normal and price below the 30-day MA on both assets, there is no confirmed trend to ride, and breakout attempts on thin volume have a higher failure rate. Traders considering Pionex's futures grid or spot-futures arbitrage tools should note that low volatility compresses returns, so range width and leverage settings matter more than usual. The overarching fit: range-based and accumulation strategies over momentum chasing.
Risk Disclaimer
This market recap is provided for informational and educational purposes only and does not constitute financial, investment, or trading advice. Nothing herein should be construed as a recommendation to buy, sell, or hold any asset. Cryptocurrency markets are highly volatile and can result in the total loss of capital. Technical indicators, moving averages, and RSI readings describe past price behavior and are not predictive of future results. Automated trading strategies, including grid and DCA bots, carry risk of loss and do not guarantee profits. Past performance is not indicative of future performance. Readers should conduct their own research and consult a qualified financial professional before making any investment decisions. The author and publisher accept no liability for any losses incurred.
FAQ
What were BTC and ETH's prices on 2026-10-21?
BTC traded at $83,765 (+0.89% over 24 hours) and ETH at $2,472 (+0.93% over 24 hours).
Is Bitcoin overbought or oversold right now?
Neither. BTC's RSI(14) is 51.8, which is neutral territory — the market has neither stretched momentum nor capitulation conditions.
Why is ETH underperforming BTC?
ETH is down -10.23% over 30 days versus BTC's -2.84%, and its RSI of 40.0 versus BTC's 51.8 reflects weaker momentum. ETH trades more than 4% below its 30-day moving average, while BTC is just below its own.
What are the key support and resistance levels?
BTC support sits at $82,314 (7-day MA) and $79,800 (30-day low), with resistance at $83,606 (30-day MA) and $83,969 (7-day high). ETH support is $2,430 and $2,318, with resistance at $2,498 and $2,580.
What trading strategy suits today's low-volume range?
Range-bound conditions favor grid strategies, which profit from oscillation between defined support and resistance. Pionex's built-in grid bots are purpose-built for this environment, while DCA suits longer-horizon accumulation. Trend-following is less appropriate given thin volume and no confirmed directional break.


