BTC ETH Daily Recap — 2026-10-27

BTC ETH Daily Recap — 2026-10-27
Today at a Glance
Bitcoin and Ethereum both drifted lower over the past 24 hours, extending a softer multi-week tone across the two largest crypto assets. BTC trades at $79,944, down 0.26% on the day within a tight $79,506–$80,497 range, while ETH sits at $2,317, off 0.32% between $2,297 and $2,342. The more telling signal is in the broader windows: BTC is down 3.71% over seven days and 4.26% over 30 days, whereas ETH has shed 5.39% and 13.82% respectively. Both assets are trading below their 7-day and 30-day moving averages, a configuration consistent with short-term downtrends. Momentum gauges diverge in severity: BTC's RSI(14) at 33.7 sits just above oversold territory, while ETH's 25.5 is already in oversold conditions. Volume is notably thin, with BTC at 0.51x and ETH at 0.38x their 7-day averages, suggesting conviction is limited on either side of the tape.
Bitcoin Analysis
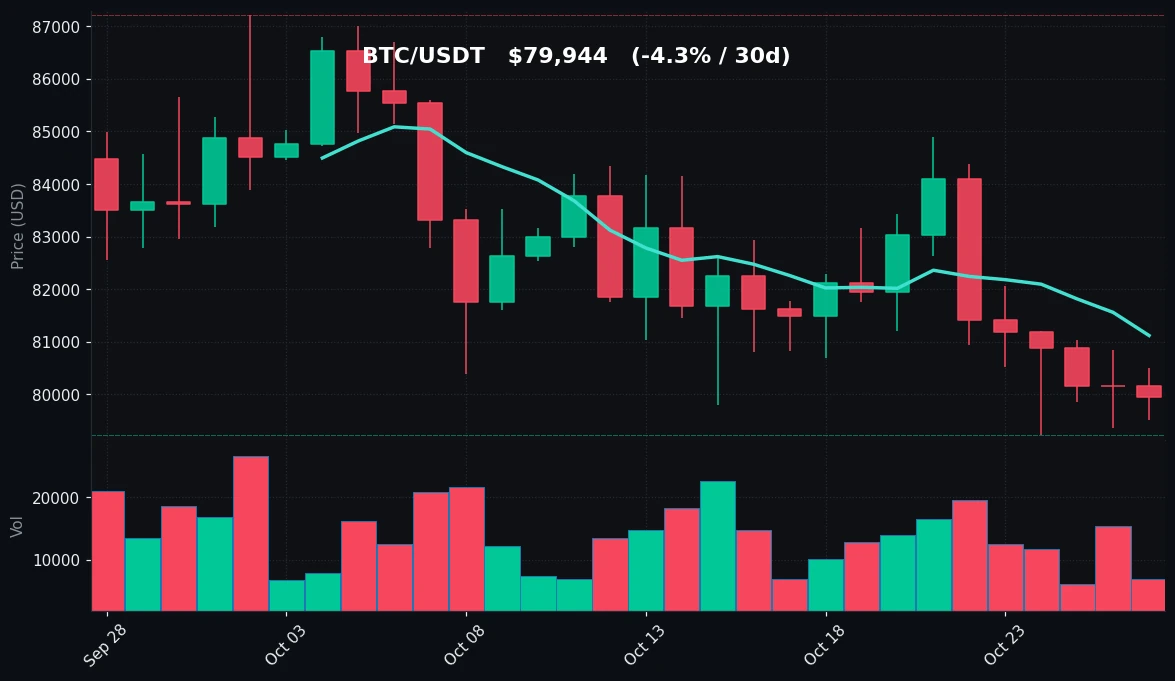
TradingView Live (4h)
Bitcoin's session was quiet in absolute terms but continued a pattern of lower highs and lower lows that has defined the past week. The 24-hour range of roughly $991 (from $79,506 to $80,497) is narrow relative to recent volatility, and the close near the lower half of that band leaves the market leaning defensive. Price is now below both the MA7 at $81,119 and the MA30 at $82,808, and the ordering of those averages — shorter below longer — reflects a market that has been grinding down rather than consolidating sideways.
The structural picture is one of a market testing the lower boundary of its recent range. The 7-day low of $79,221 and the 30-day low of $79,221 are the same figure, which is significant: it means the current price area around $79,944 is sitting just above the lowest print of the past month. That level is the immediate reference point for support. Above the market, the 7-day high of $84,898 and the 30-day high of $87,220 mark the upper bounds of the recent distribution, with the MA7 and MA30 clustered in the $81,000–$83,000 zone as intermediate resistance.
Momentum is weak but not extreme. RSI(14) at 33.7 is below the neutral 50 line and approaching the conventional 30 oversold threshold, though it has not crossed it. This is consistent with a market that has sold off steadily without a capitulation-style flush. The absence of an oversold reading on BTC — in contrast to ETH — suggests the downside pressure has been orderly.
Volume is the standout data point. At 0.51x the 7-day average, participation is roughly half of what it has been recently. Thin volume during a decline can indicate seller exhaustion, but it can equally reflect apathy and a lack of buyers. Without an expansion in volume, the move lacks confirmation in either direction. Traders watching for a durable shift would typically look for volume to accompany any break of the $79,221 low or a reclaim of the $81,119 MA7.
In sum, BTC is in a short-term downtrend, positioned near the bottom of its monthly range, with weak-but-not-oversold momentum and light participation. The key technical facts are the proximity to the $79,221 low, the overhead supply from the moving averages, and the RSI hovering just above oversold.
Ethereum Analysis
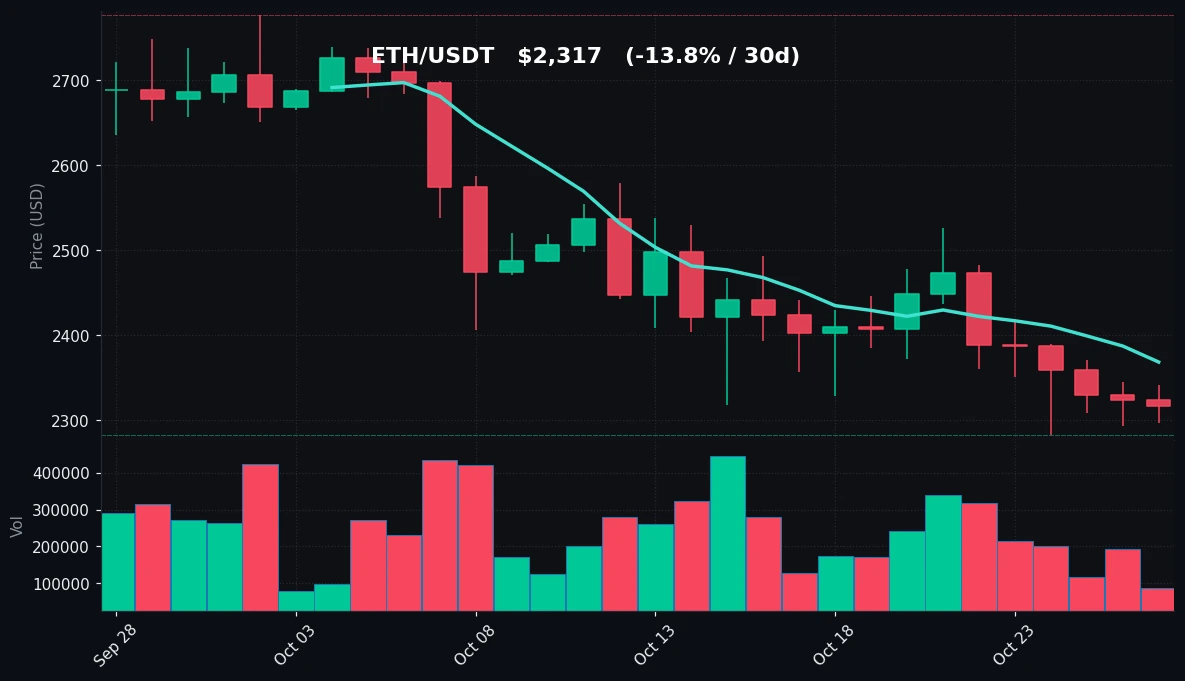
TradingView Live (4h)
Ethereum's decline has been sharper and more persistent than Bitcoin's, and today's tape reflects that. At $2,317, ETH is down 0.32% over 24 hours but 5.39% over seven days and 13.82% over 30 days — roughly three times BTC's monthly drawdown. The 24-hour range of $2,297–$2,342 was similarly compressed, but the position within the broader structure is considerably weaker.
Price is well below both the MA7 at $2,369 and the MA30 at $2,510, and the gap between spot and the 30-day average — about $193, or roughly 8% — is wider than BTC's equivalent distance. That spread indicates the recent selling has been forceful enough to pull the market meaningfully away from its medium-term trend. The 7-day low and 30-day low both print at $2,282, and with spot at $2,317, ETH is trading only about 1.5% above its monthly floor. The 7-day high of $2,527 and 30-day high of $2,777 frame the overhead range, with the moving averages sitting between spot and those highs as layered resistance.
The momentum reading is the most distinctive feature of the ETH picture. RSI(14) at 25.5 is below 30, placing ETH in oversold territory on the 14-period measure. Oversold conditions describe the speed and magnitude of the decline rather than implying an imminent reversal, but they do signal that selling has been aggressive relative to recent history. Combined with the 13.82% monthly decline, the data describes an asset that has been under sustained distribution.
Volume reinforces the cautious read. At 0.38x the 7-day average, ETH volume is even lighter than BTC's relative measure — under 40% of its recent norm. A decline on contracting volume can suggest the selling is losing fuel, but it also means there is little evidence of accumulation. As with BTC, a volume expansion would be the more meaningful signal, whether on a test of the $2,282 low or a recovery toward the $2,369 MA7.
Overall, ETH is in a clear short-term downtrend, oversold on RSI, trading near its monthly low, and doing so on thin volume. The key facts are the $2,282 support floor, the $2,369/$2,510 moving-average resistance band, and the sub-30 RSI.
Key Technical Levels
| Asset | Support | Resistance | RSI |
|---|---|---|---|
| BTC | $79,221 | $81,119 (MA7) / $82,808 (MA30) | 33.7 — neutral, approaching oversold |
| ETH | $2,282 | $2,369 (MA7) / $2,510 (MA30) | 25.5 — oversold |
BTC vs ETH Dynamic
BTC and ETH are moving in the same direction today, but the magnitude of their moves differs enough to matter. On the 24-hour timeframe the two are nearly identical — BTC -0.26%, ETH -0.32% — which is consistent with the high positive correlation the pair typically exhibits. That correlation holds in direction across the weekly window as well, with both lower. The divergence appears in scale: over 30 days ETH has fallen 13.82% against BTC's 4.26%, a ratio of more than three to one, and ETH's RSI at 25.5 versus BTC's 33.7 confirms that the altcoin has borne the brunt of the selling. In practice this means ETH is behaving as the higher-beta expression of the same market move: when the complex weakens, ETH weakens more. The shared feature is liquidity — both are trading at well under their 7-day average volume (0.51x for BTC, 0.38x for ETH) — which suggests the correlation is being driven by a broad reduction in participation rather than asset-specific flows.
Strategy Fit
Today's data describes a low-volume, mildly declining market with BTC near oversold and ETH already oversold. That combination tends to favor range-aware and accumulation-oriented approaches over momentum-chasing. For BTC, the tight 24-hour range and proximity to a well-defined floor at $79,221 make grid-style strategies — which profit from oscillation within a defined band — a natural fit for traders who expect the current range to persist. For ETH, the oversold RSI and 13.82% monthly drawdown are more consistent with dollar-cost averaging (DCA), which spreads entries over time rather than attempting to time a bottom. Trend-following strategies are the least aligned with today's conditions, given the absence of volume confirmation and the compressed intraday ranges. Pionex offers built-in bots that map to these approaches — grid trading bots for range-bound conditions and DCA bots for staggered accumulation — allowing traders to implement a chosen framework without building infrastructure. Strategy selection should always match the trader's own risk tolerance and time horizon.
Risk Disclaimer
This recap is provided for informational purposes only and does not constitute financial, investment, or trading advice. Nothing herein is a recommendation to buy, sell, or hold any asset. Cryptocurrency markets are highly volatile and can result in the total loss of capital. Technical indicators such as RSI and moving averages describe past price behavior and do not predict future outcomes. Past performance is not indicative of future results. Readers should conduct their own research and consult a qualified professional before making any financial decisions.
FAQ
What was Bitcoin's price on 2026-10-27?
BTC traded at $79,944, down 0.26% over 24 hours, within a range of $79,506 to $80,497.
Is Ethereum oversold right now?
Yes — ETH's RSI(14) is 25.5, which is below the conventional 30 threshold and indicates oversold conditions on that measure.
How far is Bitcoin from its monthly low?
BTC's 30-day low is $79,221, and spot at $79,944 is roughly 0.9% above that level.
Why is low volume significant in this recap?
BTC volume is 0.51x and ETH volume is 0.38x their 7-day averages, meaning participation is well below recent norms — a decline on thin volume lacks strong confirmation in either direction.
Which strategy types fit today's conditions?
Range-bound conditions favor grid strategies (notably for BTC), while ETH's oversold reading is more consistent with DCA. Trend-following is less aligned given thin volume and compressed ranges. Pionex's built-in grid and DCA bots support these approaches.


