BTC ETH Daily Recap — 2026-10-29

BTC ETH Daily Recap — 2026-10-29
Today at a Glance
Both major assets closed the session in the red, with Bitcoin slipping 1.26% over 24 hours to $80,316 and Ethereum falling 1.36% to $2,328. BTC traded in a narrow $1,670 range between $79,710 and $81,380, while ETH oscillated between $2,293 and $2,361. The more telling signal is on the weekly and monthly frames: ETH is down 2.57% on the week and a steep 13.34% over 30 days, materially underperforming BTC's comparatively mild -1.35% and -3.96%. Both assets sit below their 7-day and 30-day moving averages, confirming a short-term downtrend bias. Volume is notably thin — 0.55x the 7-day average for BTC and 0.53x for ETH — suggesting conviction is absent rather than panic selling. RSI readings diverge: BTC at 40.2 is in neutral-to-weak territory, while ETH at 32.7 is approaching oversold conditions.
Bitcoin Analysis
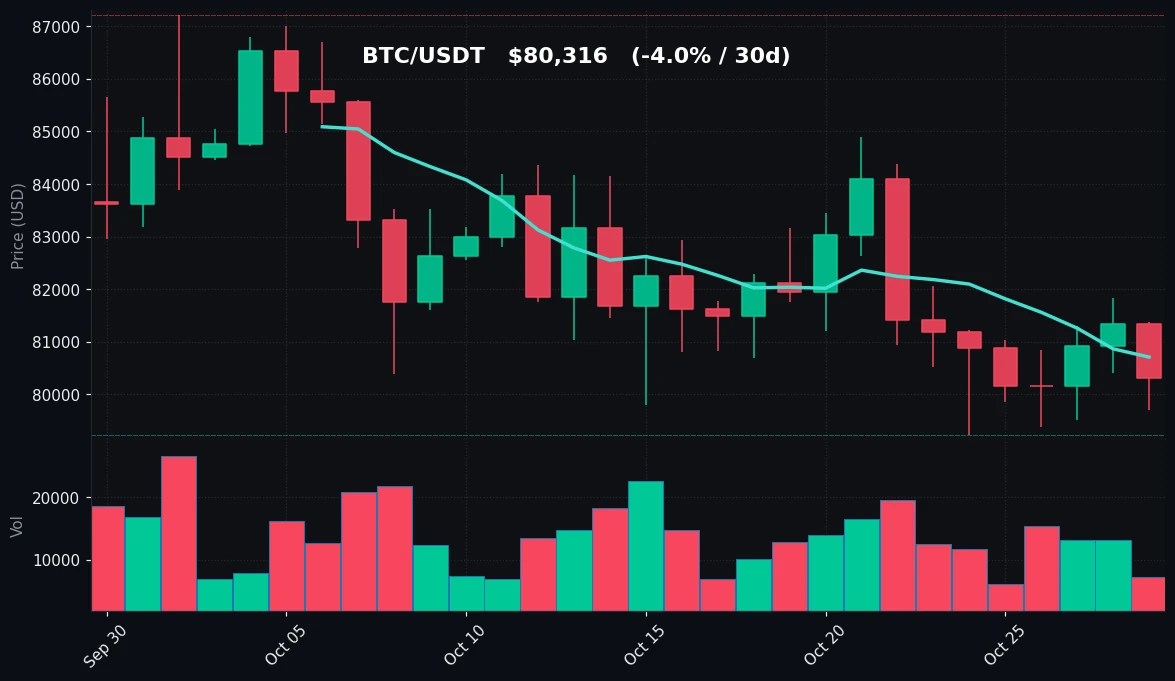
TradingView Live (4h)
Bitcoin's structure on the daily timeframe remains corrective. Price at $80,316 is trading beneath both the 7-day moving average of $80,707 and, more significantly, the 30-day MA of $82,656. That configuration — shorter MA below longer MA, with price below both — describes a market that has been grinding lower rather than capitulating. The 30-day range tells the story: BTC peaked at $87,220 within the past month and has since retraced toward the $79,221 monthly low, which also marks the 7-day low. That $79,221 level is the pivot to watch; it represents the floor of the recent consolidation and the point where sellers have twice been absorbed.
On the upside, the $82,061 seven-day high and the $82,656 30-day MA form a layered resistance zone. A reclaim of that band would be required to neutralize the current downtrend bias, though today's price action gives no indication of an imminent test. The immediate session high of $81,380 failed to hold, and the close near the lower half of the daily range reflects persistent supply.
Momentum is soft but not extreme. RSI(14) at 40.2 sits below the neutral midpoint, consistent with a market under mild distribution pressure, yet it remains well above the 30 threshold that would flag oversold conditions. This is the profile of a slow bleed — controlled, orderly selling without forced liquidation.
The volume picture reinforces the lack of conviction. At 0.55x the 7-day average, participation is roughly half of what it has been recently. Low-volume declines are ambiguous: they can signal seller exhaustion, or simply reflect a market waiting for a catalyst. What they do not indicate is broad-based panic. In practical terms, the tape is thin, which means price can move on relatively small order flow in either direction, and breakouts or breakdowns on such volume deserve skepticism until confirmed.
Taken together, BTC is in a defined downtrend on the short and medium frames, boxed between support at $79,221 and resistance near $82,000–$82,656. The neutral-weak RSI and subdued volume suggest consolidation rather than directional resolution.
Ethereum Analysis
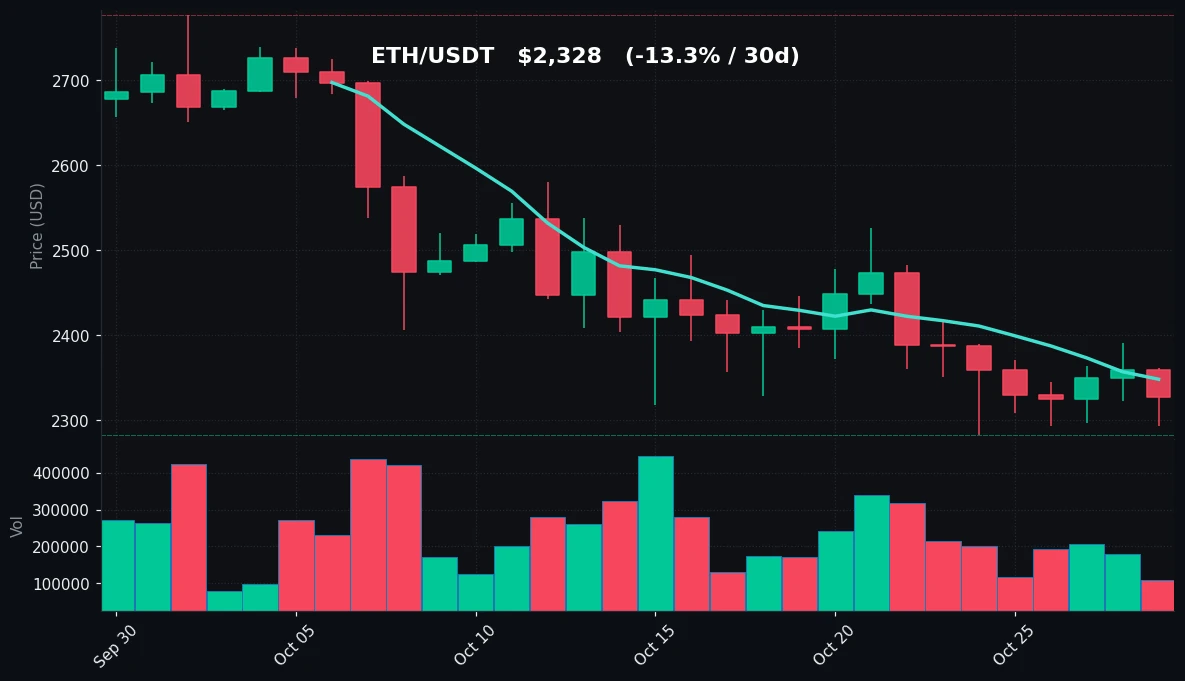
TradingView Live (4h)
Ethereum's technical picture is weaker than Bitcoin's on nearly every metric. At $2,328, ETH trades below its 7-day MA of $2,348 and far below its 30-day MA of $2,489 — a gap of roughly $161, or about 6.5%, between price and the monthly average. That distance reflects the severity of the 30-day decline of 13.34%, a drawdown more than three times BTC's over the same window. The 30-day high of $2,777 versus the current price underscores how much ground has been surrendered; ETH is trading near the very bottom of its monthly range, with the 30-day low of $2,282 essentially coinciding with the 7-day low.
That $2,282–$2,293 zone is the critical support shelf. Today's session low of $2,293 held just above it, and the 7-day low of $2,282 marks the line in the sand. A sustained break below would confirm the downtrend's continuation; a hold here would represent the first constructive sign in weeks.
Resistance is layered and close overhead: the 7-day high of $2,418, then the 7-day MA at $2,348, then the psychologically significant $2,489 30-day MA. The immediate session high of $2,361 failed, and price closed near the day's low — a weak close that favors sellers into the next session.
RSI(14) at 32.7 is the standout data point. It is approaching — but has not reached — the conventional 30 oversold threshold, placing ETH in oversold-adjacent territory. Historically, readings in the low 30s indicate that selling pressure is elevated and that downside momentum is stretched, though they are not timing signals on their own. Combined with the price sitting directly on major support, ETH is at a technical inflection point.
Volume at 0.53x the 7-day average mirrors BTC's anemic participation. The decline has occurred on declining volume, which weakens the bearish conviction case even as price structure remains negative. ETH's relative underperformance versus BTC is the defining feature of this period, and until the ratio stabilizes, the path of least resistance remains lower within the established range.
Key Technical Levels
| Asset | Support | Resistance | RSI |
|---|---|---|---|
| BTC | $79,221 | $82,061–$82,656 | 40.2 — neutral |
| ETH | $2,282 | $2,348–$2,418 | 32.7 — oversold-adjacent |
BTC vs ETH Dynamic
The two assets remain tightly correlated in direction — both fell roughly 1.3% today — but the magnitude divergence over the medium term is stark. ETH's 30-day drawdown of 13.34% versus BTC's 3.96% reflects a persistent rotation out of higher-beta altcoin exposure and into relative safety within the crypto complex. ETH's lower RSI (32.7 vs 40.2) and its position at the very floor of its monthly range confirm it is leading the downside, while BTC's cushion above its monthly low suggests it is absorbing the same macro pressure with less damage. In practice, this means ETH is functioning as the higher-volatility expression of the same underlying move; when the pair stabilizes, ETH typically prints the sharper relief bounce, and when it deteriorates, ETH breaks support first. Traders watching the ETH/BTC ratio will note it is pressing toward cycle lows — a dynamic worth monitoring as a sentiment gauge for risk appetite across the market.
Strategy Fit
Today's environment — low volume (roughly half the 7-day average on both assets), compressed ranges, RSI in neutral-to-oversold territory, and price pinned near well-defined support — is a textbook range-bound, mean-reversion setup rather than a trending one. Directional trend-following strategies face whipsaw risk here because neither asset has confirmed a breakout or breakdown, and thin liquidity makes false moves more likely. In this context, grid trading strategies, which profit from oscillation within a defined band, align naturally with the $79,221–$82,656 BTC range and the $2,282–$2,418 ETH range. For longer-horizon participants, dollar-cost averaging into oversold-adjacent conditions on ETH — at RSI 32.7 and sitting on major support — fits a patient accumulation framework, though position sizing should respect the unresolved downtrend. Pionex offers built-in bots that map directly to these approaches, including Grid Trading bots for range capture and DCA bots for systematic accumulation, with parameters that can be set around the technical levels identified above. Strategy selection should always match the trader's own risk tolerance and time horizon.
Risk Disclaimer
This market recap is provided for informational and educational purposes only and does not constitute financial, investment, or trading advice. Nothing herein should be interpreted as a recommendation to buy, sell, or hold any asset. Cryptocurrency markets are highly volatile and can result in the total loss of capital. Technical levels, RSI readings, and volume data described above are historical observations, not predictions of future price movement. Past performance is not indicative of future results. Readers should conduct their own research and consult a qualified financial professional before making any investment decisions.
FAQ
What was BTC's price on 2026-10-29?
Bitcoin traded at $80,316, down 1.26% over 24 hours, within a daily range of $79,710 to $81,380.
Why is ETH underperforming BTC?
ETH is down 13.34% over 30 days versus BTC's 3.96%, with a lower RSI (32.7 vs 40.2) and price sitting at the bottom of its monthly range — indicating capital rotation away from higher-beta altcoin exposure.
What are the key support levels to watch?
BTC support sits at $79,221 (the 7-day and 30-day low); ETH support is at $2,282–$2,293, where price is currently testing.
What does the low trading volume indicate?
Volume is roughly 0.53–0.55x the 7-day average, signaling reduced conviction and a consolidating market rather than panic selling — though thin liquidity can amplify price moves.
Which trading strategies suit current conditions?
Range-bound conditions favor grid trading, while oversold-adjacent ETH readings suit systematic DCA for longer-horizon participants. Pionex offers built-in Grid and DCA bots aligned with these approaches. This is not financial advice.


