BTC ETH Daily Recap — 2026-10-30

BTC ETH Daily Recap — 2026-10-30
Today at a Glance
Bitcoin and Ethereum both extended their recent declines on October 30, 2026, with BTC trading at $76,916 (-1.38% over 24 hours) and ETH at $2,221 (-1.43%). Both assets printed fresh multi-week lows during the session — BTC touched $76,500 and ETH $2,174 — before stabilizing modestly above those levels. Volume was elevated relative to recent activity, running at 1.34x the 7-day average for BTC and 1.4x for ETH, suggesting participation increased as prices probed lower. Momentum readings remain weak: BTC's RSI(14) sits at 31.4, just above the oversold threshold, while ETH's RSI(14) at 25.8 is already in oversold territory. Both assets trade below their 7-day and 30-day moving averages, and both are near the bottom of their 30-day ranges. ETH's underperformance is more pronounced, down 17.94% over 30 days versus BTC's 9.38%.
Bitcoin Analysis
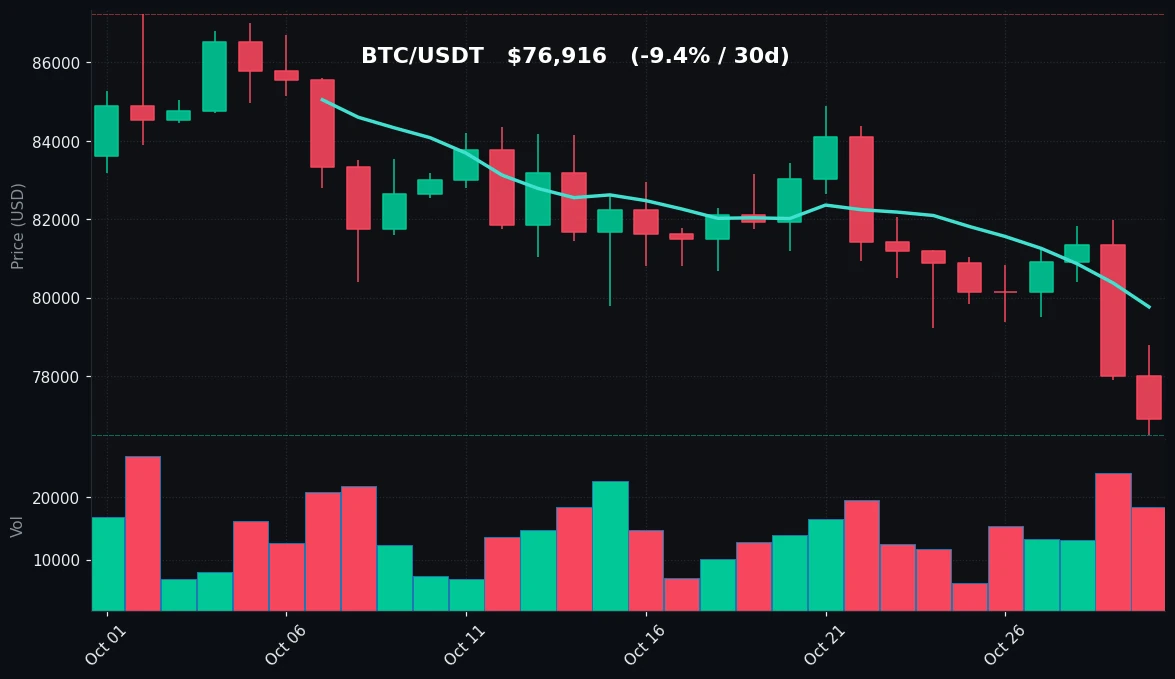
TradingView Live (4h)
Bitcoin's session on October 30 extended a downtrend that has been building across multiple timeframes. The asset opened near the upper end of its daily range at $78,804, sold off to a low of $76,500, and settled at $76,916 — a loss of 1.38% over 24 hours. That low coincides with the bottom of both the 7-day and 30-day ranges, meaning BTC has now retraced to the lowest price point it has traded at in a month. The 7-day decline stands at 5.26%, while the 30-day figure is -9.38%, indicating the pullback is not a single-session event but part of a sustained move lower.
The moving average structure is clearly bearish in its alignment. The MA7 at $79,765 sits below the MA30 at $82,355, and spot price at $76,916 trades below both. This configuration — price under short-term average, short-term average under longer-term average — reflects persistent downward pressure rather than a brief dip. The 30-day high of $87,220 is now roughly 11.8% above current price, underscoring how far BTC has traveled from its recent peak. The 7-day high of $81,971 marks the most immediate overhead reference.
Volume behavior is notable. At 1.34x the 7-day average, trading activity is above normal, and the fact that this elevated volume accompanied a move toward the lows suggests sellers remain active rather than exhausted. That said, the close at $76,916 is above the session low of $76,500, indicating some buying interest emerged at the lows.
The RSI(14) reading of 31.4 places BTC just above the conventional 30 oversold threshold. This is a zone where momentum is weak but not yet at an extreme. The indicator is consistent with the price structure — sustained selling pressure without a capitulation-level reading. Traders watching momentum would note that RSI has room to move lower before reaching deeply oversold conditions, though it is already in the lower portion of its range.
Key technical levels are well defined by recent price action. Support rests at the $76,500 session and range low, with the 30-day low confirming the same level. Resistance is layered: the MA7 at $79,765 is the first hurdle, followed by the 7-day high at $81,971 and the MA30 at $82,355. The $87,220 30-day high is the broader ceiling. Current price action is compressed near support, with the market having yet to demonstrate a reclaim of any moving average.
Ethereum Analysis
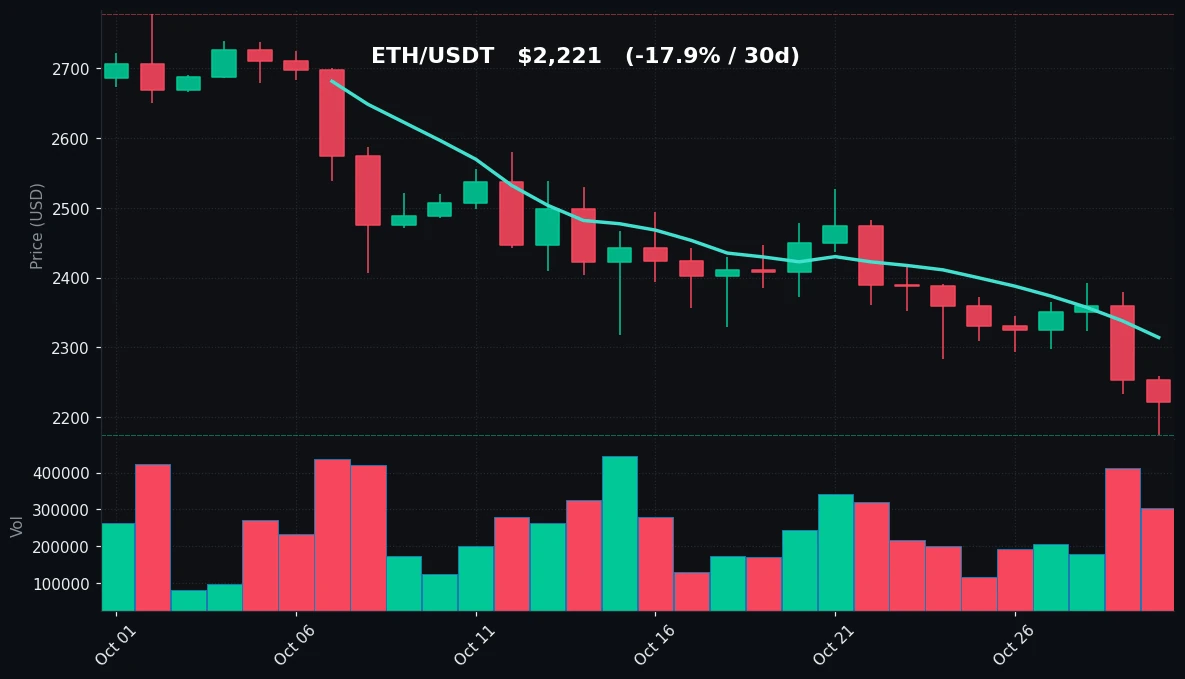
TradingView Live (4h)
Ethereum's October 30 session mirrored Bitcoin's direction but with greater magnitude in the broader trend. ETH traded between $2,259 and $2,174 before settling at $2,221, a 24-hour decline of 1.43%. As with BTC, the session low of $2,174 matches both the 7-day and 30-day lows, confirming that ETH printed a fresh monthly low during the session. The 7-day change of -6.98% and 30-day change of -17.94% show ETH underperforming BTC on both horizons — a meaningful divergence in relative strength.
The moving average picture is decisively bearish. MA7 at $2,314 and MA30 at $2,471 both sit well above spot at $2,221, with the gap to the MA30 exceeding 10%. The 30-day high of $2,777 is roughly 25% above current price, illustrating the depth of the retracement from recent highs. The 7-day high of $2,392 is the nearest upper reference, still about 7.7% above spot. Price has not reclaimed either moving average at any point in the recent window.
Volume at 1.4x the 7-day average is the highest relative reading between the two majors, indicating that ETH's move lower has attracted comparatively more participation. Elevated volume on a decline toward range lows generally reflects active distribution or forced selling rather than quiet drift.
The RSI(14) reading of 25.8 is the most technically significant data point in today's recap. ETH is now in oversold territory by the conventional 30 threshold, and has moved deeper into that zone than BTC. An oversold reading does not by itself signal a reversal — momentum can remain oversold during sustained declines — but it does indicate that short-term selling has been aggressive relative to recent history. Combined with the fresh range low and elevated volume, the momentum profile is one of heavy near-term pressure.
Support for ETH is anchored at the $2,174 session and range low. Resistance is stacked: the MA7 at $2,314, the 7-day high at $2,392, and the MA30 at $2,471, with the $2,777 30-day high as the broader ceiling. The distance between spot and the first resistance level (MA7) is roughly 4.2%, a gap that reflects how extended the current downswing has become relative to short-term averages.
Key Technical Levels
| Asset | Support | Resistance | RSI |
|---|---|---|---|
| BTC | $76,500 | $79,765 (MA7) / $81,971 (7d high) / $82,355 (MA30) | 31.4 — neutral, near oversold |
| ETH | $2,174 | $2,314 (MA7) / $2,392 (7d high) / $2,471 (MA30) | 25.8 — oversold |
BTC vs ETH Dynamic
BTC and ETH moved in the same direction on October 30, with nearly identical 24-hour percentage declines (-1.38% and -1.43%), continuing the high positive correlation that has characterized this downswing. The divergence appears in magnitude over longer windows: ETH's 30-day decline of 17.94% is nearly double BTC's 9.38%, and ETH's RSI at 25.8 versus BTC's 31.4 shows the altcoin carrying more momentum damage. Both assets printed matching range lows — BTC at $76,500 and ETH at $2,174 — on the same session, a sign that the selling was market-wide rather than asset-specific. Volume ratios were also similar (1.34x for BTC, 1.4x for ETH), suggesting broad participation. In this environment, ETH is behaving as the higher-beta expression of the same directional move, and the correlation remains tight enough that relative-strength watchers would focus on ETH's deeper oversold reading as the more stretched of the two.
Strategy Fit
Today's conditions — elevated volume, both assets near range lows, BTC RSI near oversold and ETH RSI already oversold, and price below all key moving averages — present a mixed profile for systematic strategies. Trend-following approaches face a difficult backdrop: the trend is down across both 7-day and 30-day windows, but price is compressed against support, which historically produces choppy, mean-reverting behavior at range boundaries rather than clean continuation. Grid strategies are better suited to range-bound conditions, and the well-defined boundaries (BTC $76,500–$79,765, ETH $2,174–$2,314) provide a structural framework, though the risk of a range break lower must be weighed given the persistent downtrend. DCA-style accumulation tends to appeal to longer-horizon participants during oversold readings, particularly for ETH at RSI 25.8, but it requires tolerance for further downside. Pionex offers built-in bots — including Grid Trading, DCA, and Trend-following bots — that let users implement these approaches without external tooling; the choice among them depends on each user's time horizon and risk tolerance rather than on any directional view.
Risk Disclaimer
This recap is provided for informational purposes only and does not constitute financial, investment, or trading advice. Cryptocurrency markets are highly volatile and can result in substantial or total loss of capital. Technical indicators such as RSI and moving averages describe past price behavior and do not predict future outcomes. Past performance is not indicative of future results. Readers should conduct their own research and consult a qualified professional before making any financial decisions.
FAQ
What were BTC and ETH prices on 2026-10-30?
BTC traded at $76,916 (-1.38% over 24 hours) and ETH at $2,221 (-1.43%).
Are BTC and ETH oversold?
BTC's RSI(14) is 31.4, just above the conventional 30 oversold threshold, so it is best described as neutral-near-oversold. ETH's RSI(14) is 25.8, which is in oversold territory.
What are the key support levels?
BTC support is at $76,500, its 7-day and 30-day low. ETH support is at $2,174, also its 7-day and 30-day low.
How has volume behaved?
Volume was elevated for both assets relative to recent activity: 1.34x the 7-day average for BTC and 1.4x for ETH.
Which asset has underperformed over 30 days?
ETH, with a 30-day decline of 17.94% versus BTC's 9.38%.


