BTC ETH Daily Recap — 2026-10-31

BTC ETH Daily Recap — 2026-10-31
Today at a Glance
Bitcoin and Ethereum both closed the session marginally higher, but the modest green prints do little to mask a broader corrective backdrop. BTC trades at $77,523, up 0.20% over 24 hours within a narrow $77,114–$77,745 range, yet it remains down 4.16% on the week and 8.28% over 30 days. ETH sits at $2,252, up 0.27% on the day inside a $2,237–$2,256 band, but down 4.54% weekly and 15.62% monthly — a notably deeper drawdown than BTC's. Both assets are trading below their 7-day and 30-day moving averages, confirming the near-term downtrend. Momentum gauges are approaching oversold territory: BTC RSI(14) at 33.8 and ETH at 30.1. Most striking is participation — volume is running at just 0.25x the 7-day average for BTC and 0.13x for ETH, indicating a market in wait-and-see mode rather than conviction-driven selling.
Bitcoin Analysis
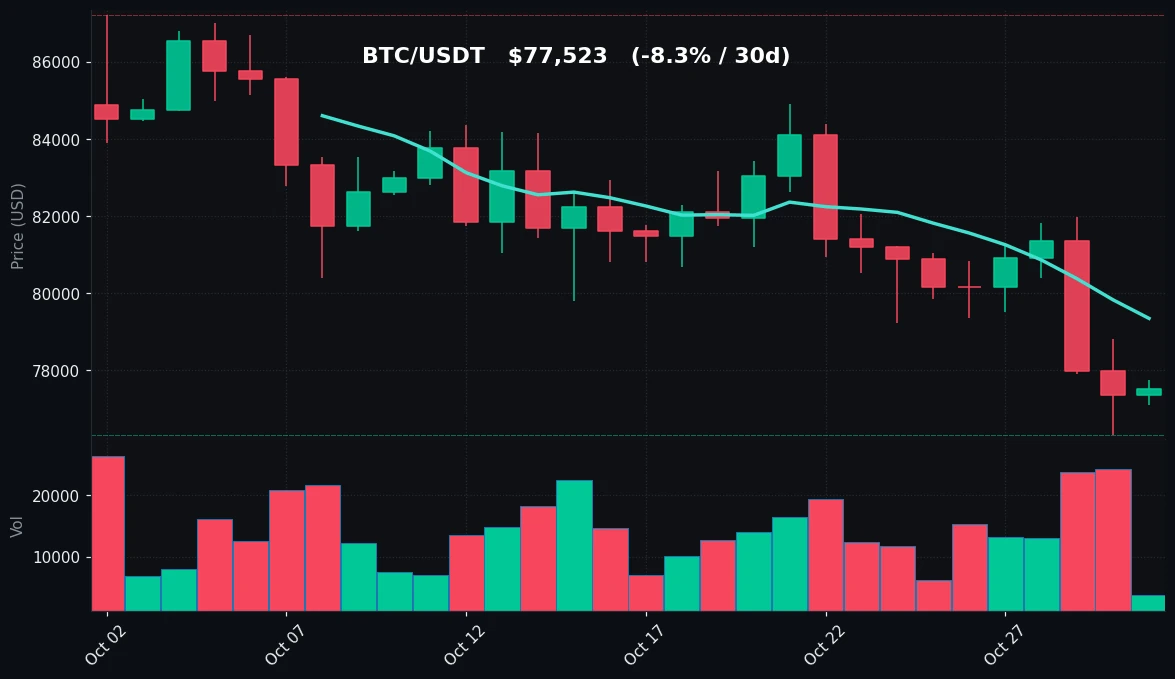
TradingView Live (4h)
Bitcoin's structural picture remains defensive. Price at $77,523 is positioned below both the MA7 ($79,349) and MA30 ($82,125), and the moving averages themselves are stacked in bearish order — the shorter MA beneath the longer — which is the classic signature of a downtrend rather than a consolidation within an uptrend. The 30-day range tells the story of the recent slide: a high of $87,220 against a low of $76,326, meaning BTC has surrendered roughly $9,700, or about 11%, from its monthly peak. The current price sits in the lower third of that range, just $1,197 above the 30-day floor.
The key technical levels are clearly defined. On the downside, $76,326 is the reference support — the 30-day and 7-day low converge there, making it a well-tested floor. A sustained break below would mark a fresh leg lower, while holding it keeps the range intact. On the upside, immediate resistance comes from the MA7 at $79,349, followed by the MA30 at $82,125 and the 7-day high of $81,971, which sits just below the 30-day average. Reclaiming the MA7 would be the first sign of short-term stabilization; reclaiming the $82,000 area would neutralize the current bearish MA structure.
RSI(14) at 33.8 places Bitcoin in the lower portion of neutral territory, approaching — but not yet inside — the conventional oversold threshold of 30. This suggests selling pressure has been persistent without reaching capitulation extremes. Notably, the daily candle is positive while RSI sits near 34, a divergence that hints at fading downside momentum rather than a confirmed reversal.
Volume is the most informative datapoint today. At 0.25x the 7-day average, participation is severely compressed. Low-volume drift within a downtrend typically reflects absence of buyers rather than active distribution, and it raises the risk of sharp moves on relatively small order flow. The 24-hour range of just $631 (0.8% of price) confirms a compressed, indecisive session. Taken together, BTC is in a low-conviction, low-liquidity holding pattern beneath its moving averages, with the $76,326 floor and $79,349 MA7 as the boundaries that matter.
Ethereum Analysis
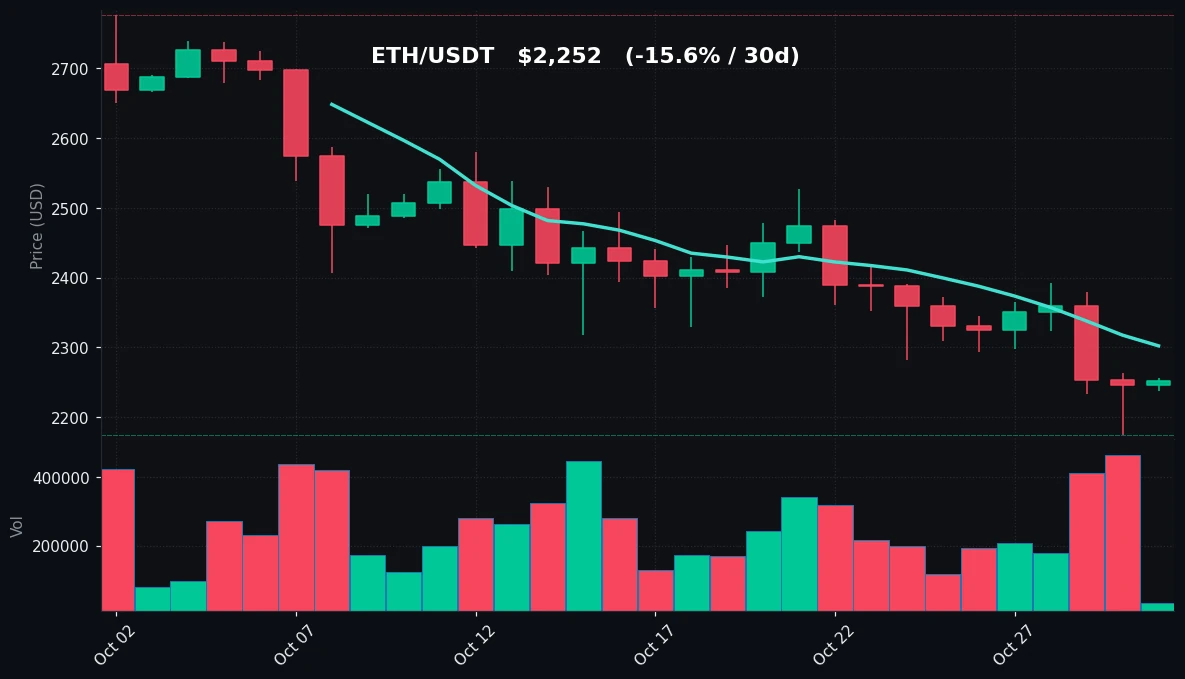
TradingView Live (4h)
Ethereum's technical position is weaker than Bitcoin's on nearly every relative measure. At $2,252, ETH trades below the MA7 ($2,302) and well below the MA30 ($2,457), with the same bearish MA stacking evident. The 30-day decline of 15.62% is nearly double BTC's 8.28%, and the monthly range — a high of $2,777 against a low of $2,174 — shows ETH has given back roughly $603, or about 22% from its peak. Price now sits just $78 above the 30-day low, placing ETH at the very bottom of its monthly range.
Support is anchored at $2,174, where the 7-day and 30-day lows coincide — a level that has already been tested and must hold to prevent further deterioration. Resistance is layered: the MA7 at $2,302 is the first hurdle, followed by the 7-day high of $2,392 and then the MA30 at $2,457. The gap between current price and the MA30 is roughly 9%, illustrating how far ETH has drifted from its recent mean.
RSI(14) at 30.1 is effectively at the oversold boundary — the most stretched reading between the two assets. As with BTC, the daily candle is modestly positive (+0.27%) despite the depressed RSI, suggesting downside momentum is decelerating even as the trend remains negative.
The volume profile is even more striking than Bitcoin's: 0.13x the 7-day average is a severe contraction, pointing to a market largely standing aside. The 24-hour range of just $19 (0.8% of price) is exceptionally tight, and with ETH pinned near its monthly low on minimal participation, the setup is one of compressed volatility at a technically sensitive location. ETH's underperformance — deeper monthly drawdown, lower RSI, thinner relative volume — marks it as the higher-beta side of the pair in the current regime. The $2,174 floor and $2,302 MA7 define the operative range.
Key Technical Levels
| Asset | Support | Resistance | RSI |
|---|---|---|---|
| BTC | $76,326 | $79,349 (MA7) / $82,125 (MA30) | 33.8 — neutral, approaching oversold |
| ETH | $2,174 | $2,302 (MA7) / $2,457 (MA30) | 30.1 — neutral, at oversold threshold |
BTC vs ETH Dynamic
The two majors remain tightly correlated in direction but divergent in magnitude. Both printed small gains today (+0.20% BTC, +0.27% ETH), both sit below their MA7 and MA30, and both show RSI in the low-30s — a shared signature of a synchronized, low-volume corrective phase. Where they diverge is in amplitude: ETH's 30-day drawdown (-15.62%) is nearly twice BTC's (-8.28%), its RSI is 3.7 points lower, and its relative volume (0.13x vs 0.25x) is roughly half. This is the classic pattern of ETH acting as the higher-beta expression of the same market move — falling harder when risk appetite fades and, by the same token, typically amplifying any recovery. For now, the correlation is one of shared direction with ETH carrying the heavier technical burden, sitting closer to its range floor and nearer to oversold.
Strategy Fit
Today's conditions — compressed ranges (0.8% for both assets), severely depressed volume (0.25x BTC, 0.13x ETH), RSI in the low-30s, and price pinned near range lows beneath falling moving averages — describe a low-volatility, range-bound tape rather than a trending one. In such environments, range-harvesting approaches tend to fit the observed structure better than momentum-following ones, since there is little directional follow-through to capture. Grid strategies, which profit from oscillation within defined boundaries, align naturally with the $76,326–$79,349 BTC band and the $2,174–$2,302 ETH band, though the tight ranges mean grid spacing must be calibrated carefully. Dollar-cost averaging appeals to those treating the drawdown as accumulation rather than trend, particularly with RSI near oversold. Trend-following strategies are the poorest fit today given the absence of momentum and volume confirmation. Pionex offers built-in bots — including Grid Trading, DCA, and Rebalancing bots — that let users implement these approaches without external tooling; the platform's grid bot in particular is designed for exactly this kind of sideways, range-bound market. Strategy selection should match each user's risk tolerance and time horizon.
Risk Disclaimer
This recap is provided for informational purposes only and does not constitute financial, investment, or trading advice. Nothing herein should be interpreted as a recommendation to buy, sell, or hold any asset. Cryptocurrency markets are highly volatile and can result in the total loss of capital. Past performance and technical indicators are not reliable predictors of future results. Always conduct your own research and consult a qualified financial professional before making any investment decision.
FAQ
What were BTC and ETH prices on 2026-10-31?
BTC traded at $77,523 (+0.20% in 24h) and ETH at $2,252 (+0.27% in 24h).
Are BTC and ETH oversold right now?
Both are approaching oversold territory but not conclusively there. BTC RSI(14) is 33.8 and ETH is 30.1 — ETH sits right at the conventional 30 threshold, while BTC remains slightly above it.
What are the key support levels to watch?
BTC support is $76,326 (the 7-day and 30-day low); ETH support is $2,174 (its 7-day and 30-day low).
Why is trading volume so low?
Volume is at 0.25x the 7-day average for BTC and 0.13x for ETH, indicating a market in wait-and-see mode with compressed participation and narrow daily ranges.
Which strategy fits the current market?
With tight ranges, low volume, and RSI near oversold, range-bound approaches like grid trading and DCA tend to fit better than trend-following. Pionex's built-in Grid, DCA, and Rebalancing bots support these approaches. This is not financial advice.


