BTC ETH Daily Recap — 2026-11-02

BTC ETH Daily Recap — 2026-11-02
Today at a Glance
Bitcoin is trading at $77,935, down 0.54% over the past 24 hours within a $77,603–$78,878 range. The move extends a softer weekly trend: BTC is down 2.76% on the 7-day and 9.93% on the 30-day, and it now sits below both its 7-day moving average ($78,784) and 30-day moving average ($81,694). RSI(14) at 34.2 places momentum in the lower-neutral zone, approaching oversold territory without crossing it, while volume at 0.45x the 7-day average signals thin participation.
Ethereum is at $2,289, up 0.62% in the last 24 hours between $2,268 and $2,318. ETH is down 1.51% on the week and 16.04% over 30 days. It is essentially pinned to its MA7 ($2,290) but remains well below MA30 ($2,430), with RSI(14) at 35.5 and volume at 0.77x the 7-day average. Both assets are consolidating near the lower end of their recent ranges on subdued volume.
Bitcoin Analysis
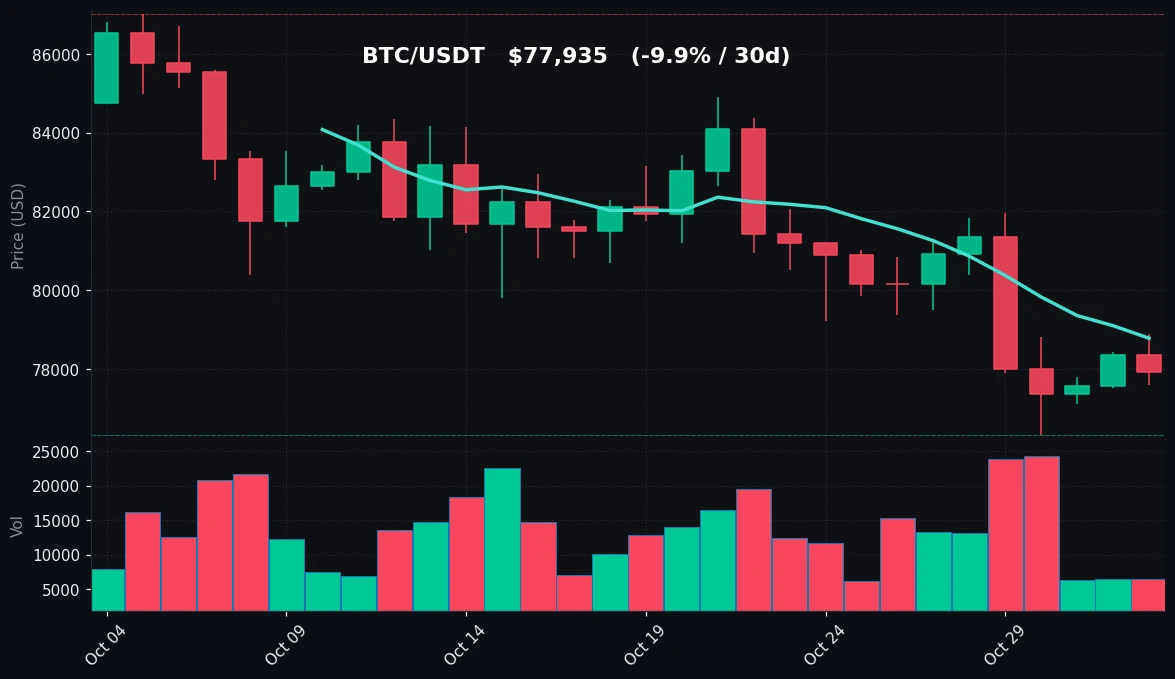
TradingView Live (4h)
Bitcoin's daily structure remains in a corrective phase. Price at $77,935 is roughly 10.4% below the 30-day high of $86,999 and only about 2.1% above the 30-day low of $76,326 — a level that also marks the 7-day low, confirming it as the most consequential near-term support in the current range. The 7-day high of $81,971 sits well above spot, meaning the past week's price action has been a controlled drift lower rather than a sharp liquidation event.
The moving average configuration is unambiguously bearish in its alignment: MA7 at $78,784 is below MA30 at $81,694, and spot trades below both. That stacked relationship — price under short-term average, short-term average under longer-term average — describes a market where recent sellers have held the initiative. However, the distance from MA30 (about 4.6% below) is moderate rather than extreme, which is consistent with an orderly retracement rather than a capitulation.
Momentum offers a more nuanced read. RSI(14) at 34.2 is in the lower-neutral band. It is not yet in oversold territory (conventionally below 30), but it is close enough that selling pressure has been persistent. Importantly, RSI in the mid-30s during a slow grind lower — as opposed to a violent spike down — often reflects fatigue rather than acceleration.
The volume picture is the most notable feature of the session. Volume at 0.45x the 7-day average is a substantial contraction. In technical terms, a decline on fading volume indicates reduced conviction among sellers; it does not confirm a bottom, but it does suggest the current move lacks aggressive distribution. Thin volume also raises the risk of outsized reactions to modest order flow in either direction.
Key levels to monitor: support at $77,603 (24h low) and the more significant $76,326 (7d and 30d low). Resistance begins at $78,784 (MA7), then $78,878 (24h high), with $81,694 (MA30) and $81,971 (7d high) as the upper boundaries of the current structure. A sustained reclaim of MA7 would be the first structural improvement; holding above $76,326 would preserve the range.
Ethereum Analysis
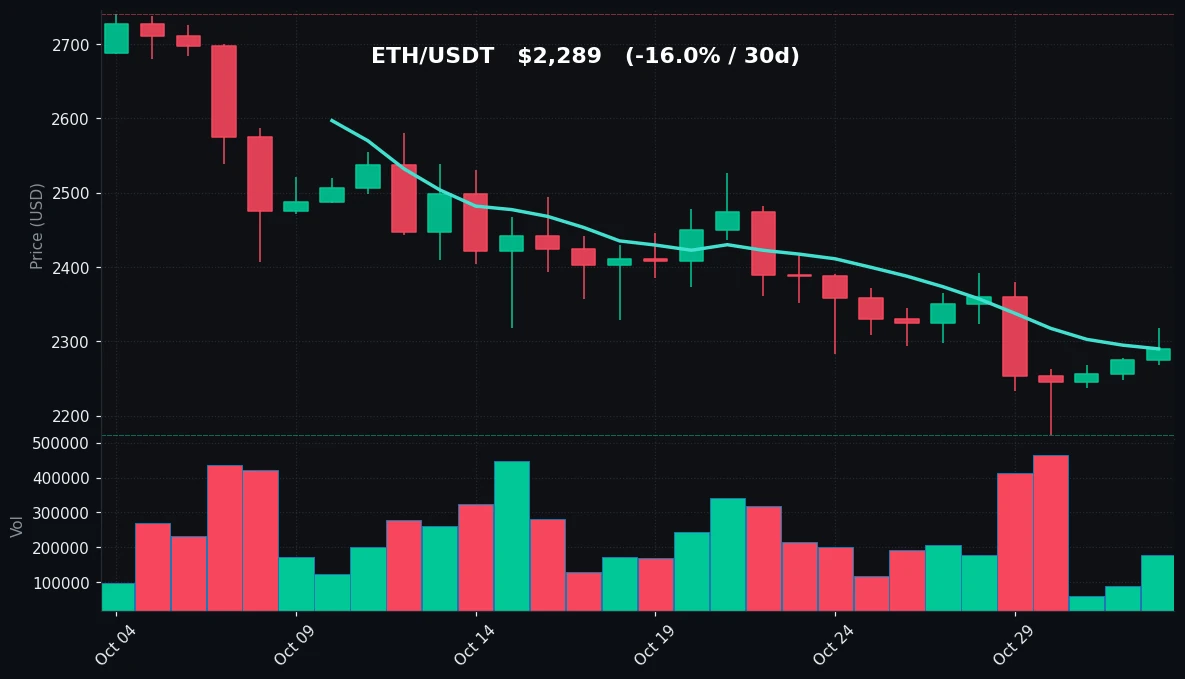
TradingView Live (4h)
Ethereum at $2,289 is marginally positive on the day (+0.62%) but deeply negative on the month (-16.04%), a divergence that frames the current session as stabilization within a larger downtrend. The 30-day range of $2,174–$2,740 is wide, and spot sits in the lower third of it — about 5.3% above the 30-day low and 16.5% below the 30-day high. The 7-day range of $2,174–$2,392 shows the same low being tested recently, reinforcing $2,174 as the pivotal support.
The moving averages tell a story of compression at the short end and distance at the long end. ETH is trading almost exactly at its MA7 ($2,290 versus spot $2,289), indicating that the past week's selling has paused and price has found an equilibrium. Against MA30 at $2,430, however, ETH is roughly 5.8% below — a wider gap than BTC's 4.6% below its MA30, consistent with ETH's steeper 30-day drawdown.
RSI(14) at 35.5 is slightly higher than BTC's 34.2 despite ETH's larger monthly decline, a subtle divergence worth noting: ETH's momentum has stabilized marginally ahead of BTC's on this reading. As with BTC, RSI remains above the oversold threshold, so the indicator describes persistent weakness rather than an exhausted move.
Volume at 0.77x the 7-day average is contracted but noticeably firmer than BTC's 0.45x. Relative volume participation in ETH is therefore higher than in BTC today, which aligns with ETH's modest positive daily performance — buyers are somewhat more active here on a relative basis, though absolute conviction remains low.
Key levels: support at $2,268 (24h low) and $2,174 (7d and 30d low). Resistance at $2,318 (24h high), $2,392 (7d high), and $2,430 (MA30). ETH's position directly on MA7 makes that level the immediate battleground; holding it keeps the stabilization intact, while losing $2,174 would extend the monthly downtrend to new lows.
Key Technical Levels
| Asset | Support | Resistance | RSI |
|---|---|---|---|
| BTC | $77,603 / $76,326 | $78,784 / $81,694 | neutral (34.2, lower band) |
| ETH | $2,268 / $2,174 | $2,318 / $2,430 | neutral (35.5, lower band) |
Both RSIs sit in the lower-neutral zone — above the conventional 30 oversold line but close enough that momentum is clearly weak. Neither asset registers as technically oversold on the 14-period reading.
BTC vs ETH Dynamic
BTC and ETH are moving in the same direction but with different amplitudes, a familiar pattern in corrective phases. Over 24 hours the pair diverges modestly — BTC -0.54%, ETH +0.62% — but over 7 and 30 days the correlation is evident: both are down on the week (-2.76% and -1.51%) and both are down sharply on the month (-9.93% and -16.04%). ETH's beta to BTC is visible in the monthly figures, where ETH's drawdown is roughly 1.6x BTC's. Their RSI readings are within 1.3 points of each other (34.2 vs 35.5), and both trade below their MA30 while hovering at or below MA7. The practical implication is that directional risk is shared: ETH's relative outperformance today is a marginal stabilization, not a decoupling, and the $76,326 BTC level and $2,174 ETH level are functionally the same risk trigger for the pair.
Strategy Fit
Today's conditions — contracted volume (0.45x for BTC, 0.77x for ETH), lower-neutral RSI, and price oscillating within defined ranges — are characteristic of a consolidation regime rather than a trending one. In such environments, range-bound approaches tend to fit better than directional ones: grid strategies can capture oscillation between the identified support and resistance bands, while DCA appeals to participants treating lower prices as accumulation zones over longer horizons. Trend-following approaches historically struggle when volume is thin and price chops sideways, since breakouts on low volume frequently fail to follow through. Pionex offers built-in bots suited to these regimes — grid trading bots for range conditions and DCA bots for staggered entry — and its futures grid for those comfortable with leverage and its attendant risks. Position sizing and range selection should reflect the fact that both assets remain in monthly downtrends, meaning range boundaries can break.
Risk Disclaimer
This recap is for informational purposes only and does not constitute financial, investment, or trading advice. Cryptocurrency markets are highly volatile; prices can move rapidly and unpredictably. Technical indicators describe past price behavior and do not predict future outcomes. Leveraged products, including futures grids, can result in losses exceeding deposits. Consult a qualified professional and never risk funds you cannot afford to lose.
FAQ
What was BTC's price on 2026-11-02?
BTC traded at $77,935, down 0.54% over 24 hours within a $77,603–$78,878 range.
How did ETH perform today?
ETH was at $2,289, up 0.62% on the day, between a low of $2,268 and a high of $2,318.
Are BTC and ETH oversold?
No. RSI(14) readings of 34.2 for BTC and 35.5 for ETH are in the lower-neutral zone, above the conventional 30 oversold threshold.
What are the key support levels?
BTC support sits at $77,603 and $76,326; ETH support at $2,268 and $2,174.
What do the low volume readings indicate?
BTC volume at 0.45x and ETH at 0.77x of their 7-day averages indicate reduced participation and lower conviction behind the current move — a hallmark of consolidation rather than decisive trend activity.


