BTC ETH Daily Recap – July 28, 2026: Consolidation Amid Low Volume

BTC ETH Daily Recap – July 28, 2026: Consolidation Amid Low Volume
Today at a Glance
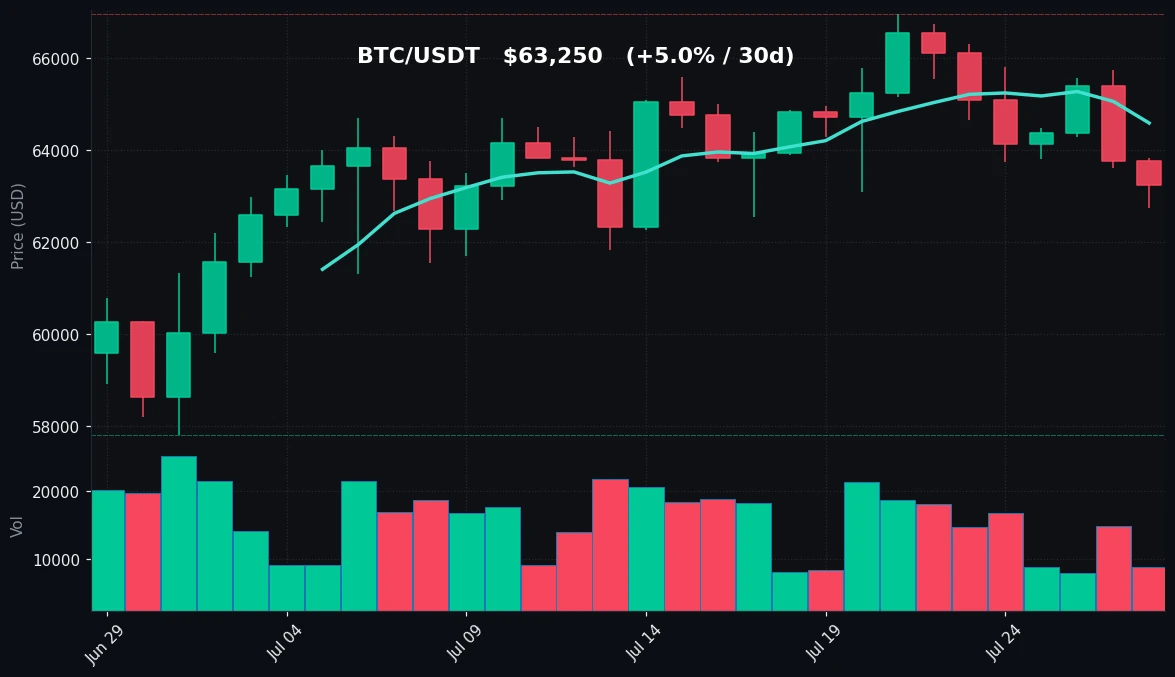
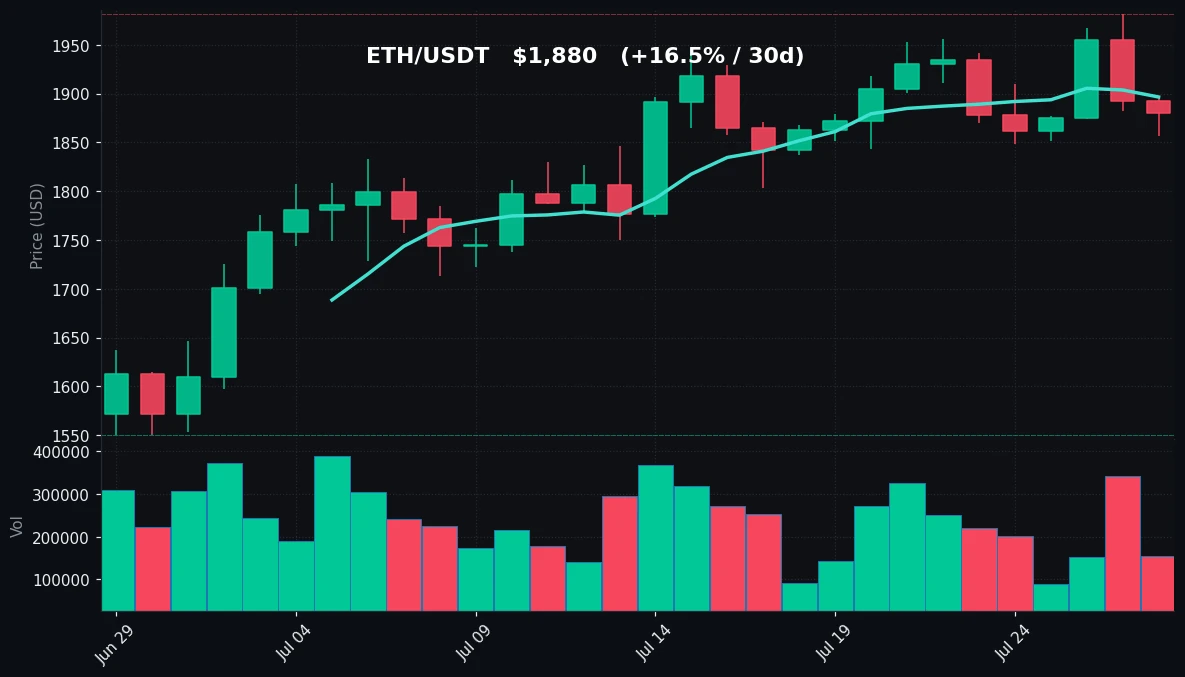
The cryptocurrency market ended July 28, 2026, on a subdued note, with both Bitcoin and Ethereum posting modest intraday losses amid significantly below-average trading volumes. Bitcoin (BTC) slipped 0.79% over the past 24 hours to close at $63,250, after oscillating between a daily low of $62,742 and a high of $63,827. The asset’s weekly performance remains negative at -4.97%, though its 30-day trajectory shows a modest recovery of +4.96%. Ethereum (ETH) fared slightly better on a relative basis, declining 0.67% to $1,880, with a daily range of $1,857 to $1,896. Over the past week, ETH has dropped 2.61%, but its 30-day gain of +16.54% underscores stronger medium-term momentum compared to Bitcoin. Both assets are trading below their respective 7-day moving averages, with RSI readings in neutral-to-oversold territory, suggesting a market in search of direction. Volume contraction—BTC at 0.62x and ETH at 0.68x of their 7-day averages—points to cautious positioning ahead of key macroeconomic events.
Bitcoin Analysis
TradingView Live (4h)
Bitcoin’s price action on July 28 reflects a market grappling with indecision. After touching a weekly low of $62,742, BTC managed to recover modestly but failed to reclaim the $63,500 level, closing at $63,250. The daily candlestick shows a narrow body with small wicks, indicating a balance between buyers and sellers at current levels. Over the past seven days, BTC has declined from a high of $66,740 to the current $63,250, a drop of approximately 5.2%, which has pushed the price below both the 7-day moving average ($64,591) and the 30-day moving average ($63,598). The price sitting below the MA7 is a short-term bearish signal, while the proximity to the MA30 suggests that the medium-term uptrend from the $57,800 low on June 28 remains intact but is weakening.
Volume analysis reveals a significant drop in participation. The current volume is only 62% of the 7-day average, indicating that the recent sell-off is not accompanied by panic or aggressive distribution. Instead, the low volume suggests a lack of conviction from both bulls and bears. The Relative Strength Index (RSI) stands at 41.0, which is in the lower half of neutral territory but approaching oversold conditions (typically below 30). This reading implies that selling pressure has been dominant over the past 14 days, but not to an extreme degree. Historically, an RSI in the low 40s during a period of declining volume often precedes a period of sideways consolidation or a short-term bounce, as sellers exhaust themselves.
Key technical levels to watch include immediate support at the $62,742 daily low, which also aligns with the June 28 low of $57,800 on a broader scale. A break below $62,700 could open the door to a test of $60,000 psychological support. On the upside, resistance is first encountered at the MA7 of $64,591, followed by the weekly high of $66,740. The $66,956 level from the 30-day high remains a critical barrier for any sustained recovery. The current setup—price below MA7, declining RSI, and low volume—suggests a market that is technically weak but not yet in a confirmed downtrend. Traders should monitor whether volume picks up on a move above $64,500, which would indicate renewed buying interest.
Ethereum Analysis
TradingView Live (4h)
Ethereum’s performance on July 28 mirrors Bitcoin’s cautious tone, though with slightly better relative strength. ETH closed at $1,880, down 0.67%, after trading between $1,857 and $1,896. The daily range was narrower than Bitcoin’s in percentage terms, signaling a tighter consolidation. Over the past week, ETH has declined from a high of $1,981 to the current level, a drop of 5.1%, which is comparable to Bitcoin’s weekly decline. However, Ethereum’s 30-day performance remains notably stronger: a gain of 16.54% from the $1,550 low on June 28, compared to Bitcoin’s 4.96% gain over the same period. This divergence highlights ETH’s superior medium-term momentum, likely driven by factors such as ETF narrative tailwinds and ecosystem developments.
Technically, ETH is trading below its 7-day moving average of $1,897 but above its 30-day moving average of $1,814. The price’s position relative to these averages suggests that the short-term trend has turned bearish, but the medium-term uptrend remains intact. The MA30 at $1,814 serves as a crucial support level; a break below it would signal a more significant trend reversal. The RSI(14) at 48.6 is almost exactly at the neutral 50 level, indicating that the asset is neither overbought nor oversold. This reading contrasts with Bitcoin’s more bearish RSI of 41.0, reinforcing the view that ETH is exhibiting greater resilience.
Volume data for ETH shows activity at 68% of the 7-day average, similarly low to Bitcoin. This contraction suggests that the recent pullback from the $1,981 high is not accompanied by aggressive selling, but rather a natural profit-taking and pause. The daily low of $1,857 held firmly, and the price closed near the middle of the range, indicating a lack of directional conviction. Key support levels to monitor are $1,857 (daily low), $1,848 (weekly low), and the MA30 at $1,814. On the upside, resistance is at $1,896 (daily high), followed by $1,897 (MA7) and the $1,981 weekly high. A decisive move above $1,900 on rising volume would be a bullish signal, while a break below $1,850 could accelerate selling toward the MA30.
Key Technical Levels
| Asset | Support | Resistance | RSI |
|---|---|---|---|
| BTC | $62,742 | $64,591 | Neutral (leaning oversold) |
| ETH | $1,857 | $1,897 | Neutral |
BTC: RSI at 41.0 is in neutral territory but approaching oversold levels. The market is not yet in panic, but the trend is weak.
ETH: RSI at 48.6 is firmly neutral, indicating a balanced market with no extreme sentiment.
BTC vs ETH Dynamic
The correlation between Bitcoin and Ethereum remains high, as evidenced by their nearly identical daily percentage changes (-0.79% vs -0.67%) and similar weekly declines (-4.97% vs -2.61%). However, the divergence in 30-day performance—ETH’s +16.54% versus BTC’s +4.96%—is a notable feature of the current market. This relative outperformance suggests that capital is rotating from Bitcoin into Ethereum, possibly driven by Ethereum’s stronger narrative around ETF approvals, Layer-2 scaling progress, or institutional accumulation. The RSI differential (BTC at 41.0 vs ETH at 48.6) further supports this view, as ETH is not as technically oversold. In a typical bearish phase, Bitcoin often leads the decline, but here Ethereum is holding up better, which could be a sign that the broader market is not in a full risk-off mode. Traders should watch whether ETH can maintain this relative strength on any further downside moves. If Bitcoin breaks below $62,700 and ETH holds above $1,850, it would confirm a divergence that could signal a potential ETH-led recovery.
Strategy Fit
Given the current market conditions—low volatility, declining volume, neutral-to-oversold RSI, and price below short-term moving averages—the most suitable strategies are those that capitalize on range-bound movement and accumulation rather than directional bets.
Grid Trading: With BTC trading in a tight range between $62,742 and $63,827 over the past 24 hours, and ETH between $1,857 and $1,896, a grid trading bot is well-suited to capture profits from these small oscillations. Pionex’s grid trading bots allow users to set buy and sell orders within a defined price range, automatically profiting from each price fluctuation. Given the low volume, the grid should be set with a wider spread to avoid being caught in false breakouts. A neutral-to-bearish grid with a lower boundary near support levels ($62,500 for BTC, $1,850 for ETH) and an upper boundary near resistance ($64,500 for BTC, $1,900 for ETH) would be appropriate.
DCA (Dollar Cost Averaging): The neutral RSI and proximity to medium-term support levels make this an attractive environment for DCA strategies. Pionex’s DCA bot allows users to buy fixed amounts of BTC or ETH at regular intervals, smoothing out entry prices. Given that BTC is near its 30-day MA and ETH is above its 30-day MA, a gradual accumulation approach reduces the risk of mistiming a single entry. DCA is particularly suitable for investors with a longer time horizon who believe the medium-term uptrend will resume.
Trend Trading: Not recommended at this time. The price is below the MA7 for both assets, and volume is declining, indicating a lack of strong directional momentum. Trend-following strategies would require a confirmed breakout above resistance levels (BTC above $64,591, ETH above $1,897) on higher volume. Until then, range-bound strategies are more appropriate.
Pionex built-in bots such as the Grid Bot, Infinity Grid Bot, and DCA Bot are well-suited for this environment. The Grid Bot can be configured for tight ranges, while the DCA Bot offers a hands-off accumulation approach. Users should avoid leveraged or futures strategies given the low volume, as slippage and liquidity risks are elevated.
Risk Disclaimer
This market recap is for informational and educational purposes only and does not constitute financial advice, investment recommendation, or solicitation to buy, sell, or hold any digital asset. Cryptocurrency markets are highly volatile and involve substantial risk of loss. Past performance and technical indicators are not guarantees of future results. The data presented is based on publicly available information and may contain errors or omissions. Always conduct your own independent research and consult with a qualified financial advisor before making any investment decisions. The use of trading bots and automated strategies does not eliminate the risk of loss. Never invest more than you are willing to lose.
FAQ
Q: Why is Bitcoin’s RSI at 41.0 but not considered oversold?
A: RSI below 30 is typically considered oversold for Bitcoin. At 41.0, it is in the lower half of neutral territory but still above the oversold threshold. This indicates that while selling pressure has been dominant over the past 14 days, it has not reached extreme levels that often precede sharp reversals.
Q: Ethereum has gained 16.54% in 30 days while Bitcoin gained only 4.96%. Why the divergence?
A: Several factors may contribute: stronger ETF narrative for Ethereum, relative undervaluation after the June lows, and capital rotation from Bitcoin into altcoins. Ethereum’s ecosystem developments and institutional interest have also provided additional support.
Q: What does low volume mean for the current market?
A: Low volume (BTC at 0.62x and ETH at 0.68x of 7-day average) suggests a lack of conviction from both buyers and sellers. It often precedes periods of consolidation or can signal that a trend is losing momentum. Low volume makes price movements less reliable and increases the risk of sudden, sharp moves.
Q: Should I use a grid bot or DCA bot in this market?
A: Both are viable. A grid bot is suitable for capturing profits from the current range-bound movement, while a DCA bot is better for long-term accumulation. The choice depends on your time horizon and risk tolerance. For short-term trading, grid bots are preferred; for long-term holding, DCA is more appropriate.
Q: What levels would indicate a trend reversal for Bitcoin?
A: A confirmed trend reversal to the upside would require a daily close above $64,591 (MA7) on rising volume, followed by a break above $66,740 (weekly high). A reversal to the downside would be signaled by a break below $62,742 (daily low) and then $57,800 (30-day low). RSI moving above 50 or below 30 would also support such moves.


