BTC ETH Daily Recap | June 15, 2026 – Bitcoin and Ethereum Show Divergent Recovery Amid Broader Bearish Pressure

BTC ETH Daily Recap | June 15, 2026 – Bitcoin and Ethereum Show Divergent Recovery Amid Broader Bearish Pressure
Today at a Glance
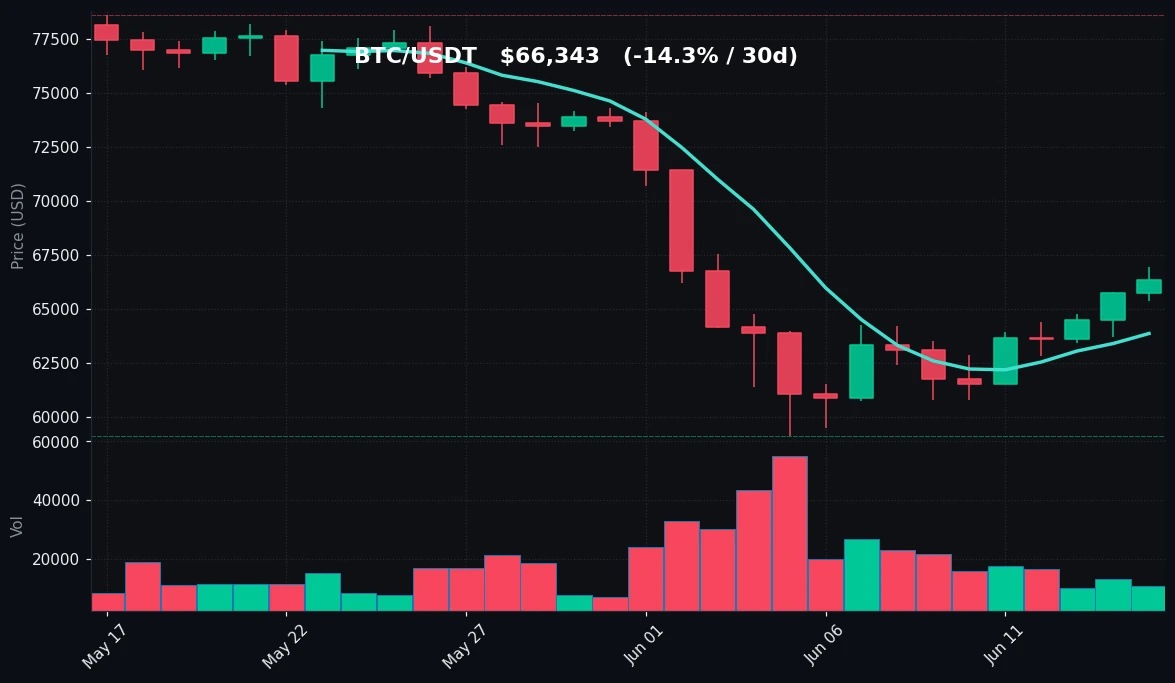
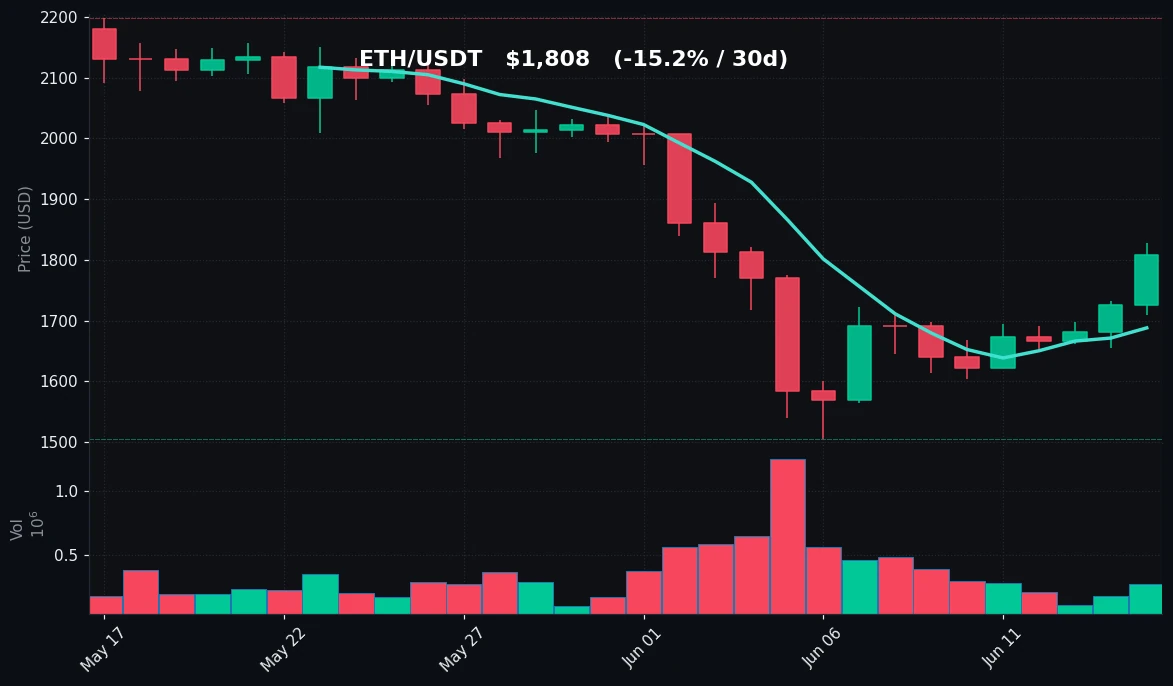
The crypto market on June 15, 2026, saw a mixed but cautiously optimistic session, with both Bitcoin and Ethereum posting gains over the past 24 hours. Bitcoin (BTC/USDT) traded at $66,343, up 0.91% in the last day, recovering from a low of $65,354 to a high of $66,949. Over the past week, BTC has gained 5.16%, though the 30-day picture remains bearish with a -14.35% decline from a high of $78,600. Ethereum (ETH/USDT) outperformed BTC in the short term, rising 4.77% to $1,808, with a 24-hour range of $1,710 to $1,828. ETH's weekly performance was even stronger at +6.94%, yet its 30-day loss of -15.16% mirrors BTC's broader weakness. Both assets remain below their 30-day moving averages, with RSI readings in the oversold-to-neutral zone (BTC at 37.2, ETH at 38.0). Volume for BTC is notably lower than its 7-day average (0.64x), while ETH's volume is near average (0.97x), suggesting a divergence in trader engagement. The market is navigating a fragile recovery phase, with short-term momentum favoring altcoins like ETH, but overall sentiment still cautious due to the steep monthly losses.
Bitcoin Analysis
TradingView Live (4h)
Bitcoin's price action on June 15 shows a modest recovery within a broader downtrend. The current price of $66,343 represents a 0.91% gain in the last 24 hours, with the session's high at $66,949 and low at $65,354. This intraday range of $1,595 indicates relatively low volatility compared to recent weeks, where BTC had swung between $59,131 and $78,600 over the past 30 days. The 7-day high of $66,949 is just above the current price, suggesting that BTC is testing resistance near this level. The 7-day low of $60,755 was a significant support test, and the recovery from that level to the current price represents a 9.2% bounce.
Key technical levels are critical here. The 7-day moving average (MA7) stands at $63,856, which is below the current price, indicating that short-term momentum has turned positive. However, the 30-day moving average (MA30) at $69,990 is well above the current price, confirming that the medium-term trend remains bearish. BTC is trading approximately 5.2% below its MA30, a gap that has been narrowing over the past few days. The RSI(14) of 37.2 remains in oversold territory (below 40), which historically signals potential for a bounce but also reflects weak buying pressure. This is the second consecutive day with RSI below 40, following a period where it dipped to 30.9 on June 12.
Volume analysis reveals a concerning divergence. The current volume is only 0.64x the 7-day average, meaning that today's price increase is occurring on significantly lower trading activity. This suggests that the rally is not widely supported by market participants and could be vulnerable to a reversal. The lack of volume also implies that institutional or large-scale buying is absent, with the move likely driven by retail or short-term speculators. The 7-day price range ($60,755 to $66,949) has established a clear support zone near $60,750, which aligns with the May 2026 lows. The resistance at $66,949 (today's high) and the psychological $70,000 level remain key barriers.
In summary, Bitcoin is in a short-term recovery phase within a medium-term downtrend. The price is above its MA7 but below MA30, with oversold RSI and declining volume. The market is watching for a decisive break above $67,000 to confirm a trend reversal, or a retest of $60,750 support if buying pressure fades.
Ethereum Analysis
TradingView Live (4h)
Ethereum's performance on June 15 is notably stronger than Bitcoin's, with a 4.77% daily gain to $1,808. The 24-hour range of $1,710 to $1,828 shows a $118 spread, indicating higher volatility than BTC. ETH's weekly performance of +6.94% also outpaces BTC's 5.16%, suggesting that altcoins are leading the recovery. Over the past 30 days, ETH has fallen 15.16% from a high of $2,198 to a low of $1,506, a drawdown that is slightly steeper than BTC's 14.35% decline. The current price is still 17.7% below the 30-day high, but the recovery from the $1,506 low represents a 20.1% bounce.
Technically, ETH is trading above its 7-day moving average of $1,688, with a gap of $120 (7.1%), indicating strong short-term momentum. The 30-day moving average at $1,900 is $92 above the current price, meaning ETH is still 4.8% below its medium-term trend. This is a smaller gap compared to BTC's 5.2% below MA30, suggesting ETH is closer to reclaiming its medium-term bullish structure. The RSI(14) of 38.0 is also in oversold territory but slightly higher than BTC's 37.2, reflecting marginally stronger buying pressure.
Volume for ETH is 0.97x the 7-day average, nearly at par, which is a positive sign compared to BTC's weak volume. This indicates that ETH's rally is supported by more active trading, possibly driven by DeFi, staking, or layer-2 narratives. The 7-day high of $1,828 is the immediate resistance, and a break above this level could target $1,900 (MA30) and then $2,000. The 7-day low of $1,603 provides support, with the 30-day low of $1,506 as a major floor.
Key observation: ETH's stronger relative performance and higher volume suggest that market participants are rotating capital from BTC to ETH, possibly in anticipation of Ethereum network upgrades or a shift in sentiment. The oversold RSI on both assets, combined with ETH's volume advantage, could lead to a period of ETH outperformance if the broader market stabilizes. However, the 30-day trend remains bearish, and any failure to break above $1,828 could see a retest of $1,700 support.
Key Technical Levels
| Asset | Support | Resistance | RSI |
|---|---|---|---|
| BTC | $60,755 (7d low), $59,131 (30d low) | $66,949 (24h high), $69,990 (MA30) | 37.2 – Oversold |
| ETH | $1,710 (24h low), $1,603 (7d low) | $1,828 (24h high), $1,900 (MA30) | 38.0 – Oversold |
BTC vs ETH Dynamic
The correlation between BTC and ETH remains positive, but the magnitude of moves is diverging. Over the past 24 hours, ETH gained 4.77% versus BTC's 0.91%, resulting in an ETH/BTC ratio increase of approximately 3.8%. This suggests that ETH is leading the recovery, a pattern often seen when altcoins outperform during risk-on periods. However, both assets share the same medium-term bearish structure, with 30-day losses exceeding 14%. The volume divergence is notable: BTC's volume is 0.64x its 7-day average, while ETH's is 0.97x, indicating that trader interest is shifting toward ETH. Historically, when ETH volume significantly outpaces BTC, it can signal a potential altseason or a rotation of capital within the crypto ecosystem. The RSI readings are nearly identical (37.2 vs 38.0), confirming that both are in oversold territory but ETH has marginally stronger momentum. The 7-day performance gap (ETH +6.94% vs BTC +5.16%) further supports ETH's relative strength. If this divergence continues, ETH could challenge its MA30 ($1,900) before BTC reaches its MA30 ($69,990), potentially widening the ratio further. However, any broad market sell-off would likely drag both assets down, given their high correlation over longer timeframes.
Strategy Fit
Given the current market conditions—oversold RSI, low volume for BTC, moderate volume for ETH, and mixed short-term momentum—a multi-strategy approach is warranted. Grid trading is particularly suitable for the current environment, as both BTC and ETH are trading in well-defined ranges (BTC: $60,755–$66,949; ETH: $1,603–$1,828). A grid bot can capture profits from the price oscillations within these ranges, especially with ETH's higher volatility and volume. On Pionex, users can deploy a neutral grid with a range covering the 7-day high and low, which aligns with the current support and resistance levels.
Dollar-cost averaging (DCA) is also appropriate for long-term accumulation, given the oversold RSI and the fact that both assets are trading below their 30-day moving averages. DCA into BTC or ETH at current levels could benefit from a potential mean reversion, but with the understanding that further downside is possible. Pionex's DCA bot allows for automated periodic purchases, reducing timing risk.
Trend-following strategies are less reliable now, as the 30-day trend is bearish but the 7-day trend is bullish. The conflicting signals (price above MA7 but below MA30) create a choppy environment where trend-following bots may generate false signals. However, if BTC breaks above $67,000 or ETH above $1,830 with volume, a trend-following bot could be activated to ride the momentum.
Pionex's built-in bots are well-suited for these conditions. The Grid Trading bot can be configured for BTC/USDT or ETH/USDT with a range of $60,000–$67,000 for BTC and $1,600–$1,850 for ETH. The Infinity Grid bot can handle wider ranges if volatility increases. The DCA bot can be set with a fixed interval (e.g., daily) to accumulate during the oversold period. Users should avoid leveraged bots given the uncertainty, as the 30-day trends are still bearish.
In summary, a combination of grid trading for short-term range plays and DCA for long-term accumulation is the most prudent strategy today. Avoid aggressive trend-following until a clear breakout or breakdown occurs.
Risk Disclaimer
This market recap is for informational and educational purposes only and does not constitute financial advice, investment recommendation, or solicitation to buy or sell any cryptocurrency. Trading cryptocurrencies involves substantial risk, including the potential loss of all capital. Past performance and technical indicators are not guarantees of future results. The data and analysis presented are based on publicly available information as of June 15, 2026, and may change rapidly. Always conduct your own research, assess your risk tolerance, and consult with a qualified financial advisor before making investment decisions. The author and platform assume no liability for any losses incurred from trading activities based on this content.
FAQ
Q: Why is BTC volume so low compared to its 7-day average?
A: BTC's volume is 0.64x its 7-day average, indicating reduced trading activity. This could be due to a lack of major news, market participants waiting for a clearer trend, or capital rotating into altcoins like ETH. Low volume on a price increase often suggests the rally is not fully supported and may be vulnerable to a reversal.
Q: Is the RSI of 37.2 for BTC a buy signal?
A: An RSI below 40 is considered oversold, which historically can precede a bounce. However, it is not a definitive buy signal. In bear markets, RSI can remain oversold for extended periods. The RSI should be used in conjunction with other indicators like moving averages and volume to assess risk.
Q: Why is Ethereum outperforming Bitcoin today?
A: ETH's 4.77% gain vs BTC's 0.91% suggests a rotation into altcoins. This could be driven by ETH-specific catalysts (e.g., network upgrades, DeFi activity) or simply because ETH had a larger drawdown from its 30-day high (-15.16% vs BTC's -14.35%), leading to a stronger bounce. Higher volume on ETH also supports the move.
Q: What are the key levels to watch for Bitcoin?
A: Key support is at $60,755 (7-day low) and $59,131 (30-day low). Key resistance is at $66,949 (today's high) and $69,990 (30-day moving average). A break above $67,000 with volume could signal a trend reversal, while a drop below $60,750 would confirm continued bearish pressure.
Q: How can I use Pionex bots in this market?
A: For the current range-bound conditions, the Grid Trading bot is ideal. Set a range for BTC/USDT between $60,000 and $67,000, or for ETH/USDT between $1,600 and $1,850. For long-term accumulation, use the DCA bot to buy small amounts daily. Avoid leveraged or trend bots until a clear breakout occurs.


